Answered step by step
Verified Expert Solution
Question
1 Approved Answer
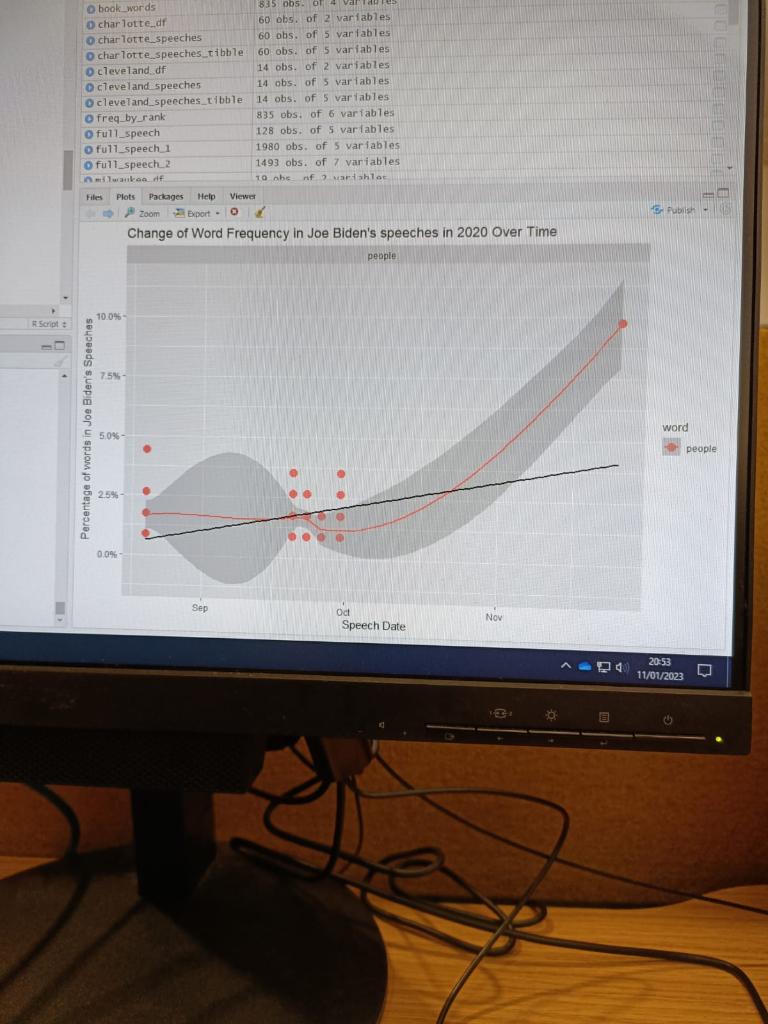
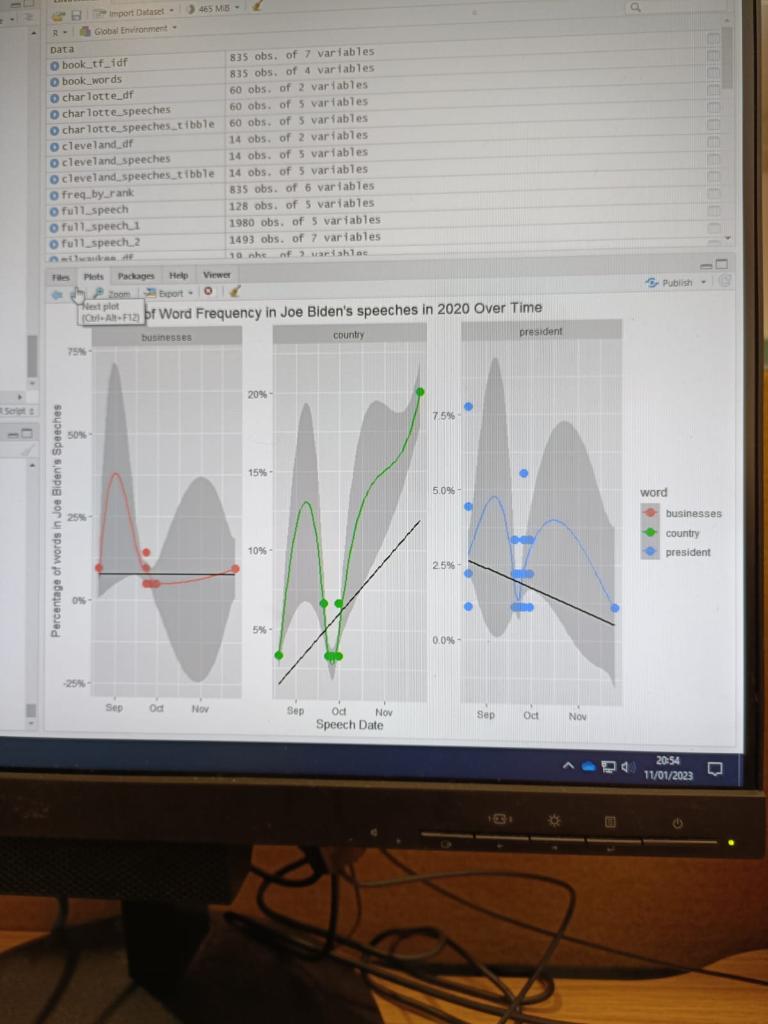
I want to know how to explain the R studio Graphs, This graphs are produced to get the An R function that produces a plot


I want to know how to explain the R studio Graphs, This graphs are produced to get the An R function that produces a plot showing how the proportion of given words in Joe Bidens speeches changes over time with a suitable help page.6 different text files have been used to produce this graphs. Please help me
Change of Word Frequency in Joe Biden's speeches in 2020 Over Time businesses. country presidentStep by Step Solution
There are 3 Steps involved in it
Step: 1

Get Instant Access to Expert-Tailored Solutions
See step-by-step solutions with expert insights and AI powered tools for academic success
Step: 2

Step: 3

Ace Your Homework with AI
Get the answers you need in no time with our AI-driven, step-by-step assistance
Get Started


