

Question
I want to know the correct answers and how to calculate them. I don't want the handwritten version. I can't see clearly. In addition, I
I want to know the correct answers and how to calculate them. I don't want the handwritten version. I can't see clearly. In addition, I have received the wrong answer many times, if you can't please don't give me the wrong answer, I will report you.
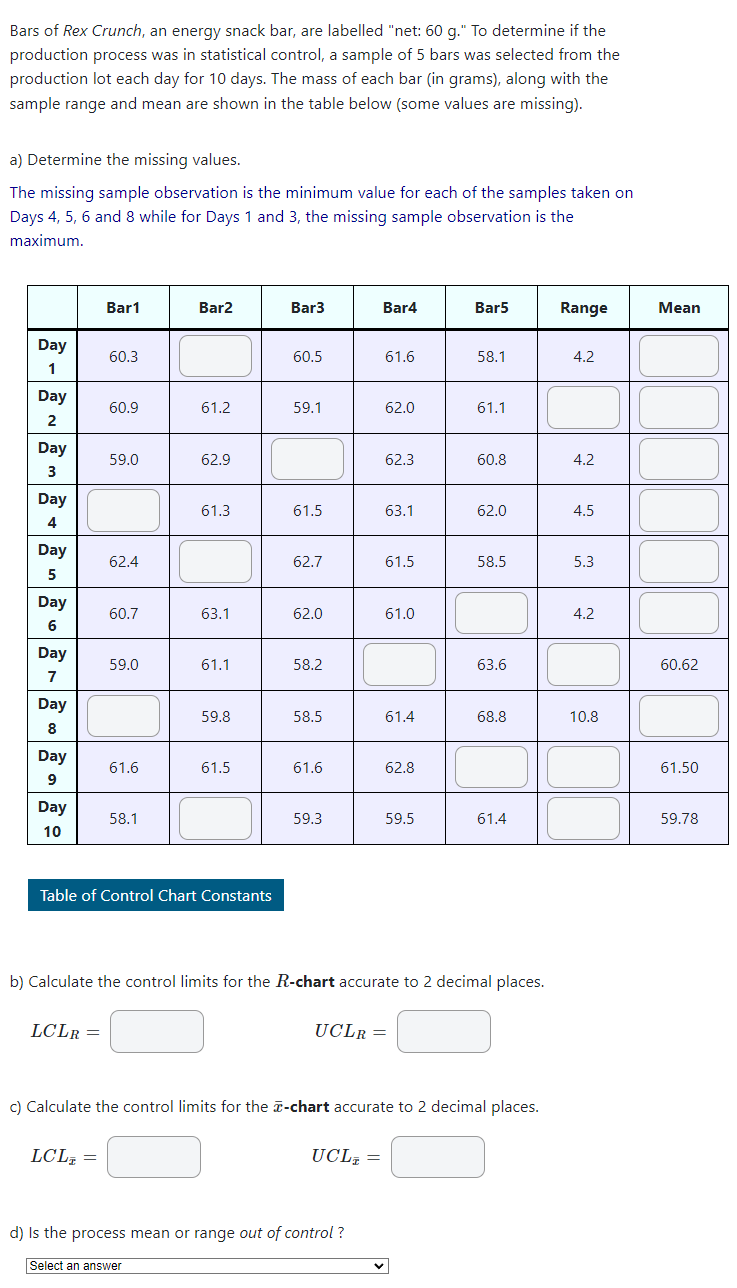
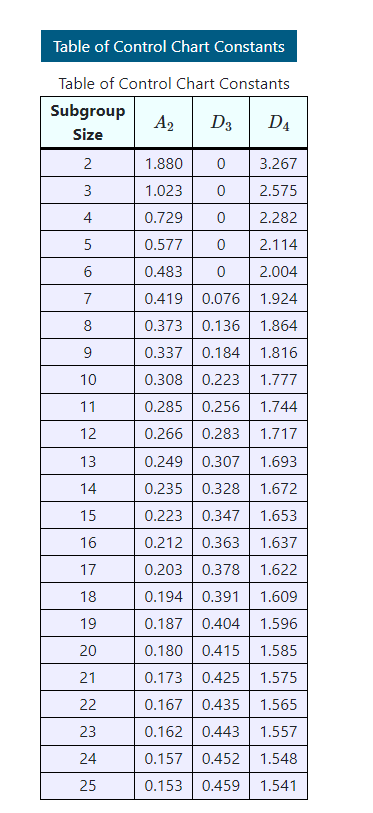
Bars of Rex Crunch, an energy snack bar, are labelled "net: 60 g." To determine if the production process was in statistical control, a sample of 5 bars was selected from the production lot each day for 10 days. The mass of each bar (in grams), along with the sample range and mean are shown in the table below (some values are missing). a) Determine the missing values. The missing sample observation is the minimum value for each of the samples taken on Days 4, 5, 6 and 8 while for Days 1 and 3, the missing sample observation is the maximum. Bar1 Bar2 Bar3 Bar4 Bar5 Range Mean Day 1 60.3 60.5 61.6 58.1 4.2 Day 2 60.9 61.2 59.1 62.0 61.1 59.0 62.9 62.3 60.8 4.2 Day 3 3 Day 4 61.3 61.5 63.1 62.0 4.5 Day 5 62.4 62.7 61.5 58.5 5.3 Day 6 60.7 63.1 62.0 61.0 4.2 Day 7 59.0 61.1 58.2 63.6 60.62 Day 59.8 58.5 61.4 68.8 10.8 8 Day 9 61.6 61.5 61.6 62.8 61.50 Day 58.1 59.3 59.5 61.4 59.78 10 Table of Control Chart Constants b) Calculate the control limits for the R-chart accurate to 2 decimal places. LCLR= UCLR= c) Calculate the control limits for the T-chart accurate to 2 decimal places. LCL= = UCL = d) Is the process mean or range out of control ? Select an answer Table of Control Chart Constants DS DA Table of Control Chart Constants Subgroup A2 D4 Size 2 1.880 0 3.267 3 1.023 0 2.575 4 0.729 0 2.282 5 0.577 0 2.114 6 0.483 0 2.004 7 0.419 0.076 1.924 8 0.373 0.136 1.864 9 0.337 0.184 1.816 10 0.308 0.223 1.777 11 0.285 0.256 1.744 12 0.266 0.283 1.717 13 0.249 0.307 1.693 14 0.235 0.328 1.672 15 0.223 0.347 1.653 16 0.212 0.363 1.637 17 0.203 0.378 1.622 18 0.194 0.391 1.609 19 0.187 0.404 1.596 20 0.180 0.415 1.585 21 0.173 0.425 1.575 22 0.167 0.435 1.565 23 0.162 0.443 1.557 24 0.157 0.452 1.548 25 0.153 0.459 1.541 Bars of Rex Crunch, an energy snack bar, are labelled "net: 60 g." To determine if the production process was in statistical control, a sample of 5 bars was selected from the production lot each day for 10 days. The mass of each bar (in grams), along with the sample range and mean are shown in the table below (some values are missing). a) Determine the missing values. The missing sample observation is the minimum value for each of the samples taken on Days 4, 5, 6 and 8 while for Days 1 and 3, the missing sample observation is the maximum. Bar1 Bar2 Bar3 Bar4 Bar5 Range Mean Day 1 60.3 60.5 61.6 58.1 4.2 Day 2 60.9 61.2 59.1 62.0 61.1 59.0 62.9 62.3 60.8 4.2 Day 3 3 Day 4 61.3 61.5 63.1 62.0 4.5 Day 5 62.4 62.7 61.5 58.5 5.3 Day 6 60.7 63.1 62.0 61.0 4.2 Day 7 59.0 61.1 58.2 63.6 60.62 Day 59.8 58.5 61.4 68.8 10.8 8 Day 9 61.6 61.5 61.6 62.8 61.50 Day 58.1 59.3 59.5 61.4 59.78 10 Table of Control Chart Constants b) Calculate the control limits for the R-chart accurate to 2 decimal places. LCLR= UCLR= c) Calculate the control limits for the T-chart accurate to 2 decimal places. LCL= = UCL = d) Is the process mean or range out of control ? Select an answer Table of Control Chart Constants DS DA Table of Control Chart Constants Subgroup A2 D4 Size 2 1.880 0 3.267 3 1.023 0 2.575 4 0.729 0 2.282 5 0.577 0 2.114 6 0.483 0 2.004 7 0.419 0.076 1.924 8 0.373 0.136 1.864 9 0.337 0.184 1.816 10 0.308 0.223 1.777 11 0.285 0.256 1.744 12 0.266 0.283 1.717 13 0.249 0.307 1.693 14 0.235 0.328 1.672 15 0.223 0.347 1.653 16 0.212 0.363 1.637 17 0.203 0.378 1.622 18 0.194 0.391 1.609 19 0.187 0.404 1.596 20 0.180 0.415 1.585 21 0.173 0.425 1.575 22 0.167 0.435 1.565 23 0.162 0.443 1.557 24 0.157 0.452 1.548 25 0.153 0.459 1.541
Step by Step Solution
There are 3 Steps involved in it
Step: 1

Get Instant Access to Expert-Tailored Solutions
See step-by-step solutions with expert insights and AI powered tools for academic success
Step: 2

Step: 3
Ace Your Homework with AI
Get the answers you need in no time with our AI-driven, step-by-step assistance
Get Started
Bitcoin Cash What You Need To Know About Bch
Authors: Alexander O. M.
1st Edition
1976721229, 978-1976721229