

Question
I want to know what my chart of the historical market values of my portfolio represents. I do not know how to read these graphs
I want to know what my chart of the historical market values of my portfolio represents. I do not know how to read these graphs and I want a solid explanation of how my stock portfolio is represented compared to the market. It does seem like I did better than the market overall especially in November. THOUGHTS? 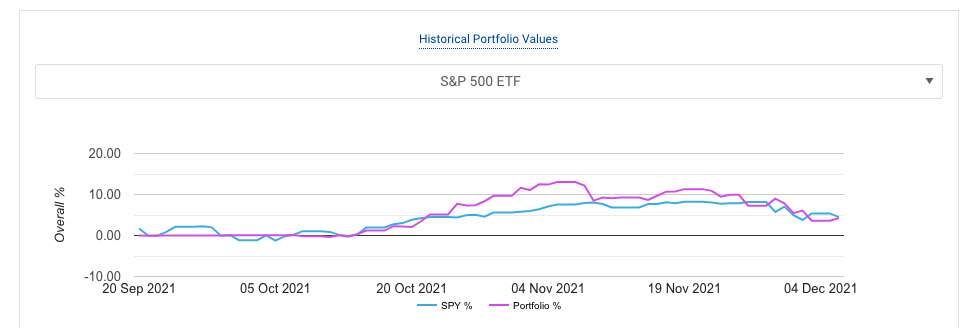
Step by Step Solution
There are 3 Steps involved in it
Step: 1

Get Instant Access to Expert-Tailored Solutions
See step-by-step solutions with expert insights and AI powered tools for academic success
Step: 2

Step: 3
Ace Your Homework with AI
Get the answers you need in no time with our AI-driven, step-by-step assistance
Get Started
Credit Derivatives Handbook Global Perspectives Innovations And Market Drivers
Authors: Greg Gregoriou, Paul Ali
1st Edition
0071549528, 978-0071549523