Question
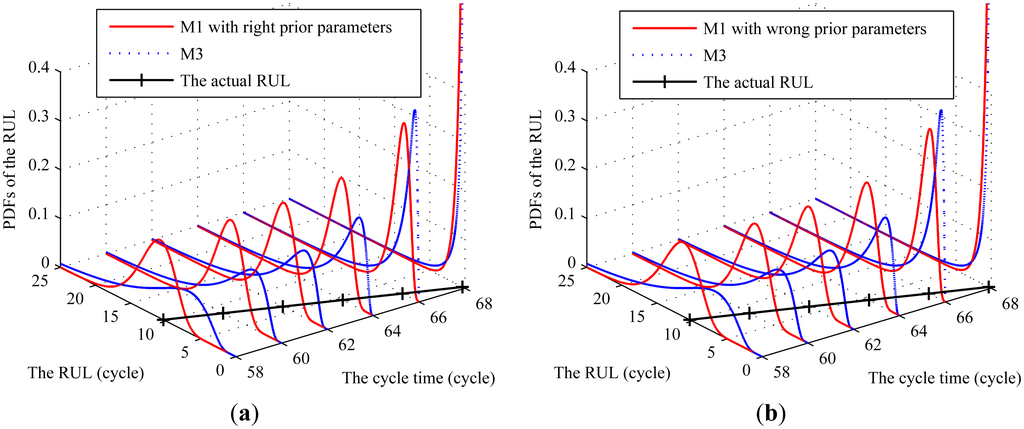
I want to plot multiple density curves in a single graph like the attached one. In this graph I want variable values (fixed) in one
I want to plot multiple density curves in a single graph like the attached one. In this graph I want variable values (fixed) in one axis say X, normal pdf values in Z and how many parameter set is being used in Y axis... Can anybody please help me regarding this??? Thanks in advance...
Data set can be like this:
X = -3:0.01:3; X = X';
pd1 = normpdf(X, 0, 1);
pd2 = normpdf(X, 1, 1);
pd3 = normpdf(X, 2, 1);
pd4 = normpdf(X, 3, 1);
In X axis it will contain X values. In Z axis it will show pd values and in Y axis it will show 1, 2, 3, 4.i want to do this by using matlab function .
here we have to construct series of normal distribution by using loop
Step by Step Solution
There are 3 Steps involved in it
Step: 1

Get Instant Access to Expert-Tailored Solutions
See step-by-step solutions with expert insights and AI powered tools for academic success
Step: 2

Step: 3

Ace Your Homework with AI
Get the answers you need in no time with our AI-driven, step-by-step assistance
Get Started


