Answered step by step
Verified Expert Solution
Question
1 Approved Answer
I want to write a MATLAB code to draw the intensity of a LED. I have a data set of angle (20, 40, 60, 80,
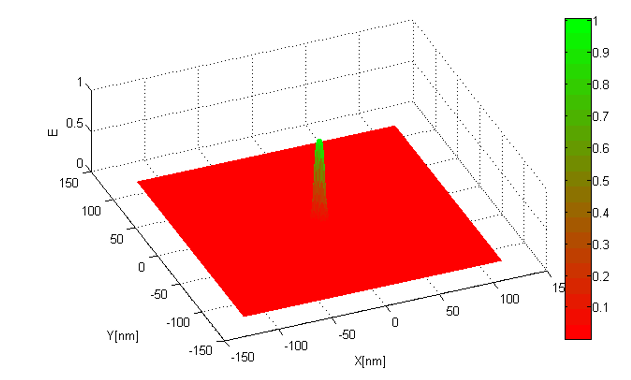
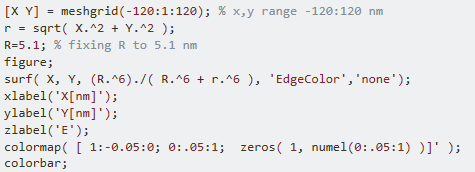
I want to write a MATLAB code to draw the intensity of a LED. I have a data set of angle (20, 40, 60, 80, 110, 130, 150) and its lux are (14, 20, 26, 30, 27, 21, 13) respectively. The height is 1m fixed. The graph should be similar to the above where it also shows the intensity bar. The code is above (I COPIED THIS FROM SOMEONE ELSE ONLINE. THIS IS NOT MY CODE OR PLOT). Please help with MATLAB codes also!
0.9 0.8 0.7 0.6 0.5 0.4 0.3 0.2 0.1 0.5 0 150 100 50 0 -50 100 50 100 YInm150 150 100 0 100 m) [X Y] = meshgrid(-120:1:120); % x,y range -120:120 nm r- sqrtx."2 + Y.*2 ); R 5.1; % fixing R to 5.1 nm figure; surf X, Y, (R.*6)./(R.46 r.*6 ), EdgeColor''none) xlabel('X[nm]); ylabel('Y[nm]) zlabel('E) colormap 1:-0.05:0; 0:.05:1 zeros( 1, numel(0:.05:1)]; colorbar; 0.9 0.8 0.7 0.6 0.5 0.4 0.3 0.2 0.1 0.5 0 150 100 50 0 -50 100 50 100 YInm150 150 100 0 100 m) [X Y] = meshgrid(-120:1:120); % x,y range -120:120 nm r- sqrtx."2 + Y.*2 ); R 5.1; % fixing R to 5.1 nm figure; surf X, Y, (R.*6)./(R.46 r.*6 ), EdgeColor''none) xlabel('X[nm]); ylabel('Y[nm]) zlabel('E) colormap 1:-0.05:0; 0:.05:1 zeros( 1, numel(0:.05:1)]; colorbarStep by Step Solution
There are 3 Steps involved in it
Step: 1

Get Instant Access to Expert-Tailored Solutions
See step-by-step solutions with expert insights and AI powered tools for academic success
Step: 2

Step: 3
Ace Your Homework with AI
Get the answers you need in no time with our AI-driven, step-by-step assistance
Get Started