

Answered step by step
Verified Expert Solution
Question
1 Approved Answer
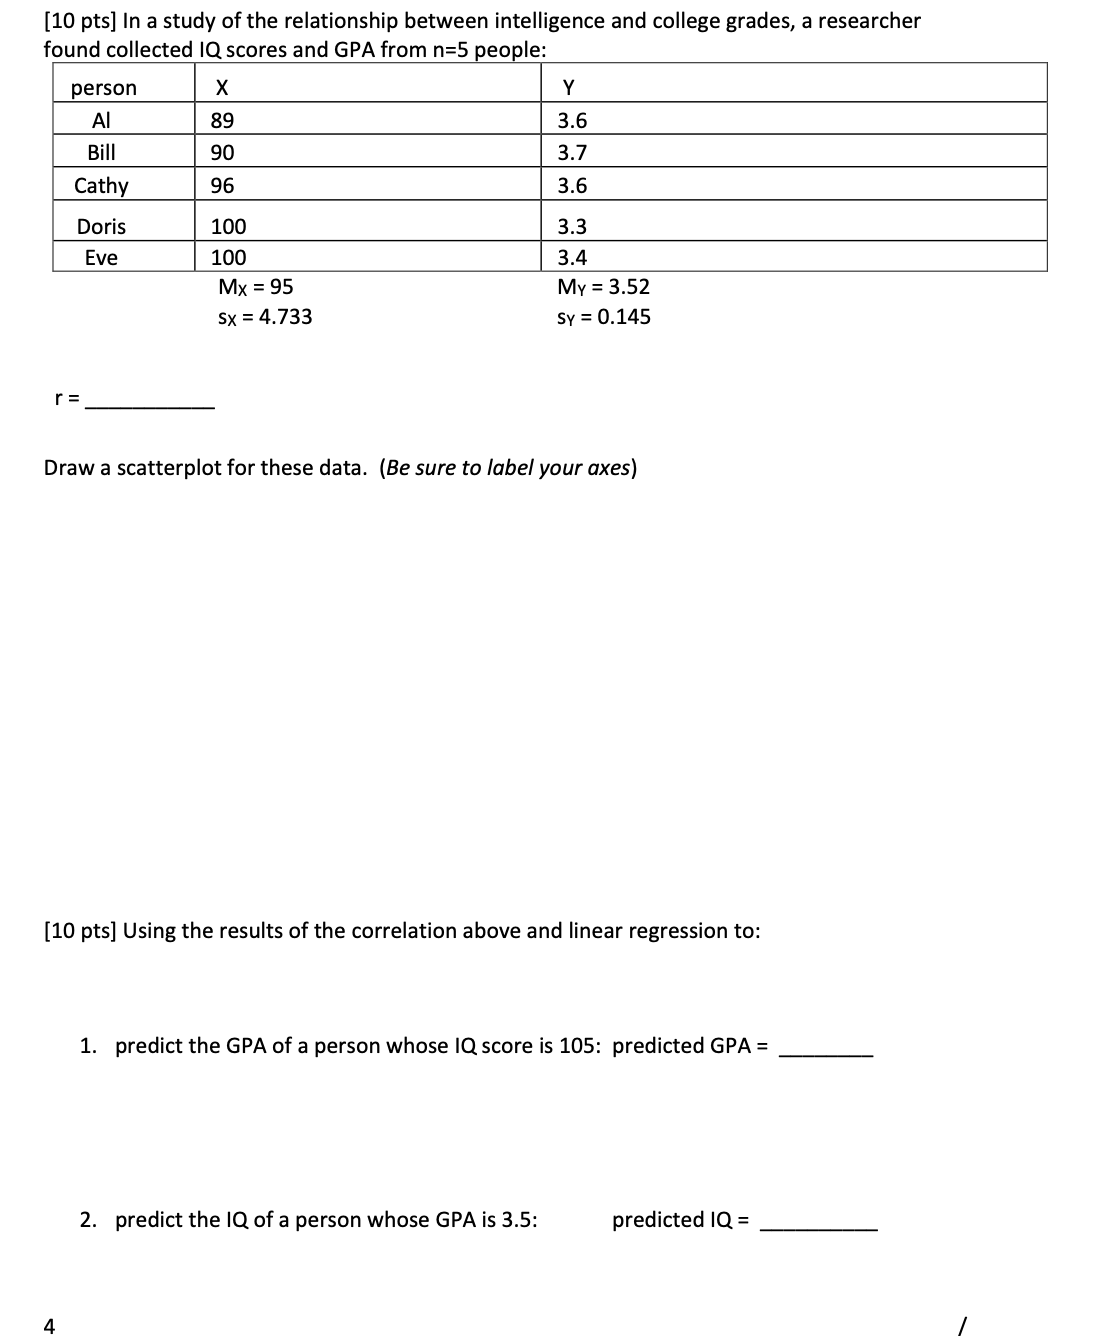
I was able to figure out the scatterplot but I'm having trouble seeing if I got R correct and doing the predictions on the bottom.
I was able to figure out the scatterplot but I'm having trouble seeing if I got R correct and doing the predictions on the bottom.
(round decimals to the thousandths place at each step)
Step by Step Solution
There are 3 Steps involved in it
Step: 1

Get Instant Access to Expert-Tailored Solutions
See step-by-step solutions with expert insights and AI powered tools for academic success
Step: 2

Step: 3
Ace Your Homework with AI
Get the answers you need in no time with our AI-driven, step-by-step assistance
Get Started
Intermediate Algebra
Authors: Marvin L Bittinger
11th Edition
0321968395, 9780321968395