I will rate you up if you solve these questions
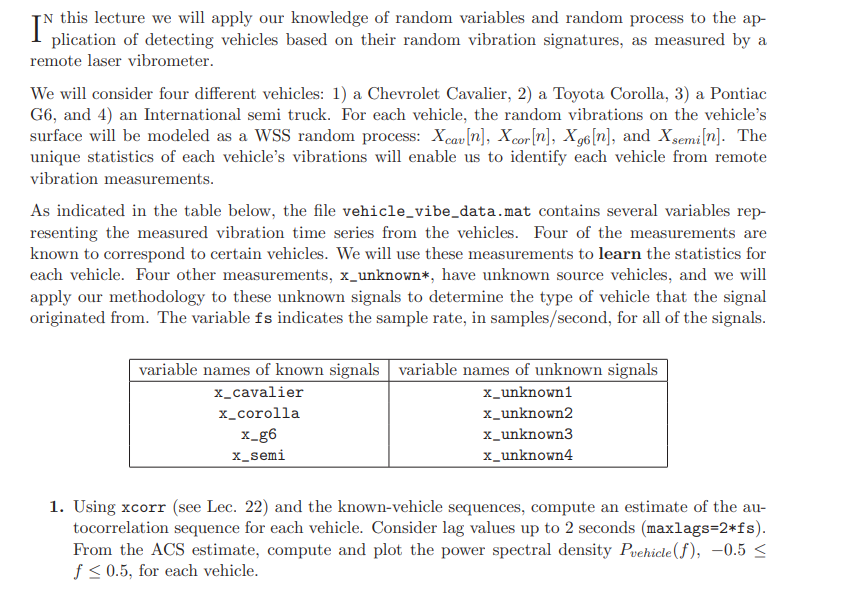
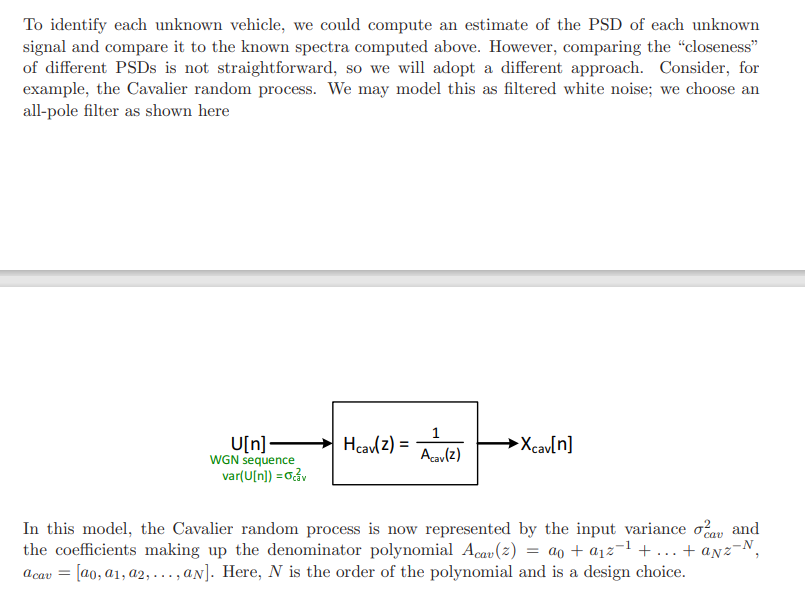
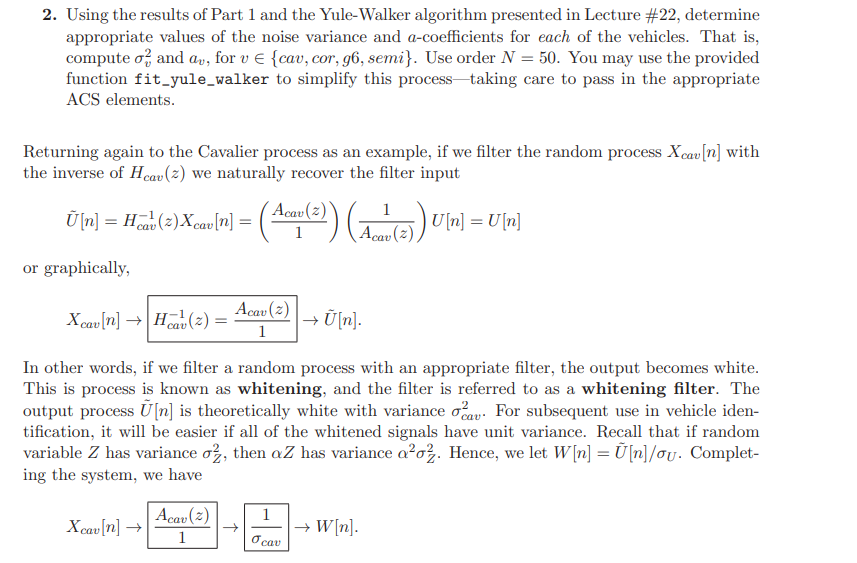
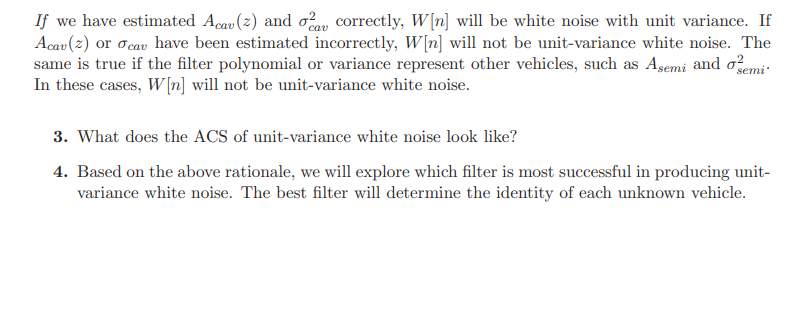
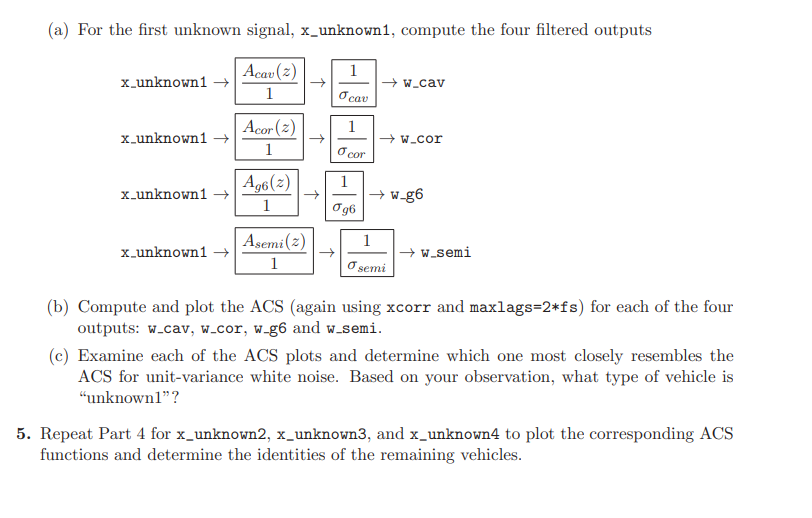
. plication of detecting vehicles based on their random vibration signatures, as measured by a remote laser vibrometer. We will consider four different vehicles: 1) a Chevrolet Cavalier, 2) a Toyota Corolla, 3) a Pontiac G6, and 4) an International semi truck. For each vehicle, the random vibrations on the vehicle's surface will be modeled as a WSS random process: Xcav[n], Xcor[n], Xg6[n], and Xsemi[n]. The unique statistics of each vehicle's vibrations will enable us to identify each vehicle from remote vibration measurements. As indicated in the table below, the file vehicle_vibe_data.mat contains several variables rep- resenting the measured vibration time series from the vehicles. Four of the measurements are known to correspond to certain vehicles. We will use these measurements to learn the statistics for each vehicle. Four other measurements, x_unknown*, have unknown source vehicles, and we will apply our methodology to these unknown signals to determine the type of vehicle that the signal originated from. The variable fs indicates the sample rate, in samples/second, for all of the signals. variable names of known signals variable names of unknown signals X_cavalier x_unknown x_corolla x_unknown2 x-g6 x_unknown x_semi x_unknown4 1. Using xcorr (see Lec. 22) and the known-vehicle sequences, compute an estimate of the au- tocorrelation sequence for each vehicle. Consider lag values up to 2 seconds (maxlags=2*fs). From the ACS estimate, compute and plot the power spectral density Puehicle(f), -0.5 f w_cor ocor 1 x_unknown1 Ag6(2) 1 w-g6 096 1 x_unknown1 Asemi(2) 1 w.semi osemi (b) Compute and plot the ACS (again using xcorr and maxlags=2*fs) for each of the four outputs: w.cav, w-cor, w-g6 and w_semi. (c) Examine each of the ACS plots and determine which one most closely resembles the ACS for unit-variance white noise. Based on your observation, what type of vehicle is "unknown1"? 5. Repeat Part 4 for x_unknown2, x_unknown3, and x_unknown4 to plot the corresponding ACS functions and determine the identities of the remaining vehicles. . plication of detecting vehicles based on their random vibration signatures, as measured by a remote laser vibrometer. We will consider four different vehicles: 1) a Chevrolet Cavalier, 2) a Toyota Corolla, 3) a Pontiac G6, and 4) an International semi truck. For each vehicle, the random vibrations on the vehicle's surface will be modeled as a WSS random process: Xcav[n], Xcor[n], Xg6[n], and Xsemi[n]. The unique statistics of each vehicle's vibrations will enable us to identify each vehicle from remote vibration measurements. As indicated in the table below, the file vehicle_vibe_data.mat contains several variables rep- resenting the measured vibration time series from the vehicles. Four of the measurements are known to correspond to certain vehicles. We will use these measurements to learn the statistics for each vehicle. Four other measurements, x_unknown*, have unknown source vehicles, and we will apply our methodology to these unknown signals to determine the type of vehicle that the signal originated from. The variable fs indicates the sample rate, in samples/second, for all of the signals. variable names of known signals variable names of unknown signals X_cavalier x_unknown x_corolla x_unknown2 x-g6 x_unknown x_semi x_unknown4 1. Using xcorr (see Lec. 22) and the known-vehicle sequences, compute an estimate of the au- tocorrelation sequence for each vehicle. Consider lag values up to 2 seconds (maxlags=2*fs). From the ACS estimate, compute and plot the power spectral density Puehicle(f), -0.5 f w_cor ocor 1 x_unknown1 Ag6(2) 1 w-g6 096 1 x_unknown1 Asemi(2) 1 w.semi osemi (b) Compute and plot the ACS (again using xcorr and maxlags=2*fs) for each of the four outputs: w.cav, w-cor, w-g6 and w_semi. (c) Examine each of the ACS plots and determine which one most closely resembles the ACS for unit-variance white noise. Based on your observation, what type of vehicle is "unknown1"? 5. Repeat Part 4 for x_unknown2, x_unknown3, and x_unknown4 to plot the corresponding ACS functions and determine the identities of the remaining vehicles


