

Question
I would like to generate a plot like the one below in which it combines the color map of the free energy surface and the
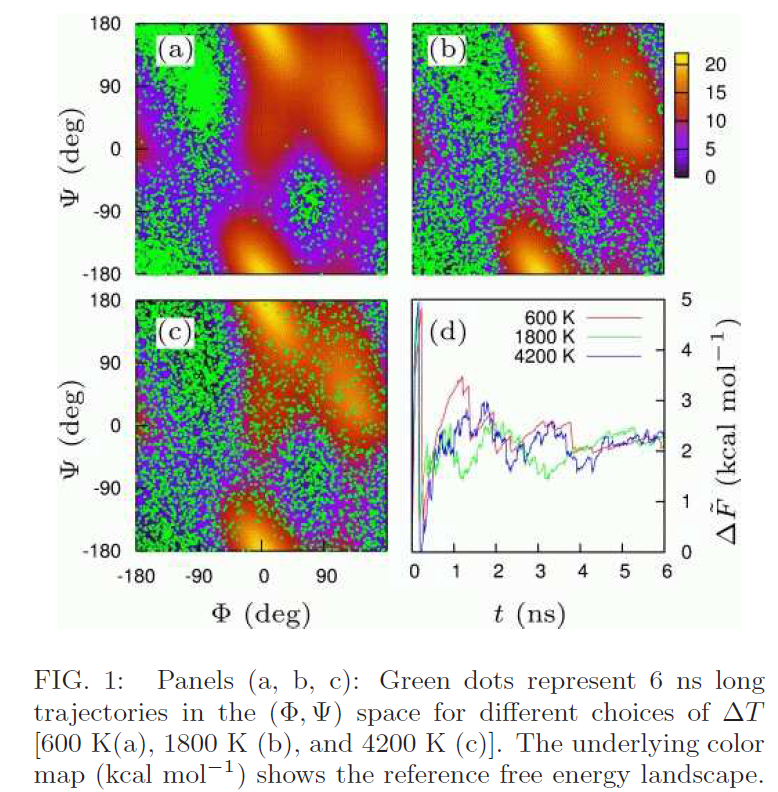
I would like to generate a plot like the one below in which it combines the color map of the free energy surface and the phi, psi space for the different delta T values. This is using linux gnuplot. I have generated these graphs separately, but how do I combine them into one graph using gnuplot?
Step by Step Solution
There are 3 Steps involved in it
Step: 1

Get Instant Access to Expert-Tailored Solutions
See step-by-step solutions with expert insights and AI powered tools for academic success
Step: 2

Step: 3
Ace Your Homework with AI
Get the answers you need in no time with our AI-driven, step-by-step assistance
Get Started
Designing Data Intensive Applications The Big Ideas Behind Reliable Scalable And Maintainable Systems
Authors: Martin Kleppmann
1st Edition
1449373321, 978-1449373320