Answered step by step
Verified Expert Solution
Question
1 Approved Answer
I would love for some help please. Thank you Need Help with B1. This is the data Make a 5-year trend analysis, using 2013 as
I would love for some help please. Thank you 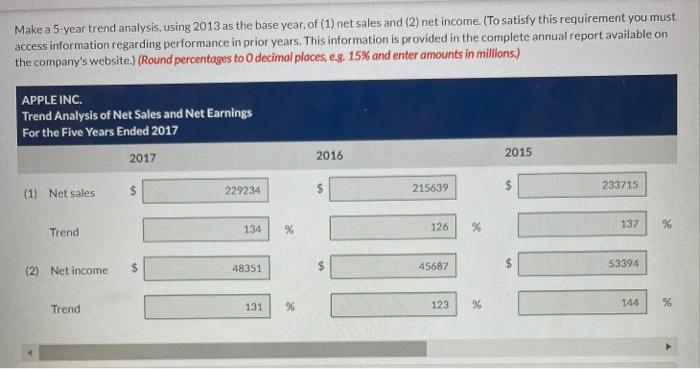
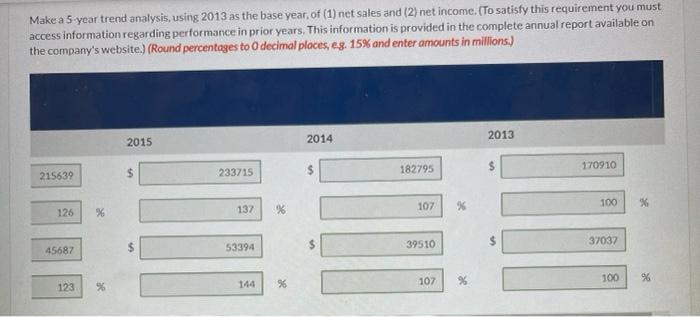


Need Help with B1. This is the data 
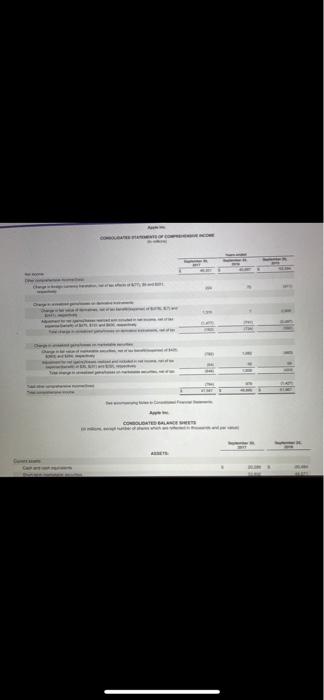
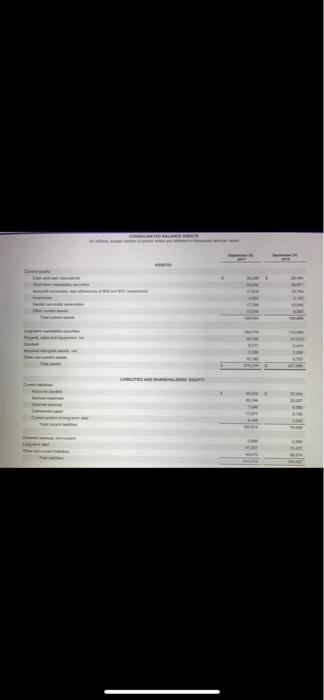
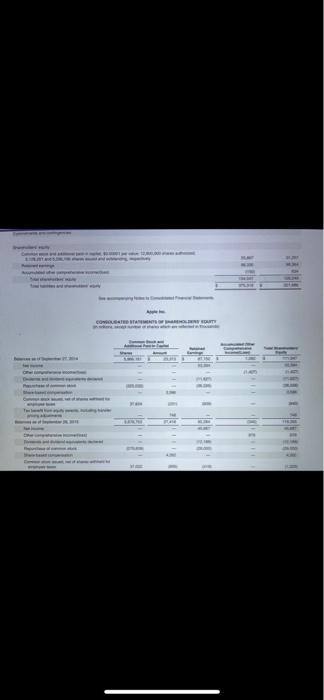
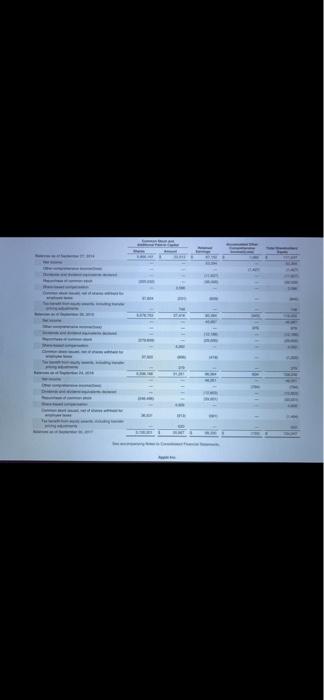
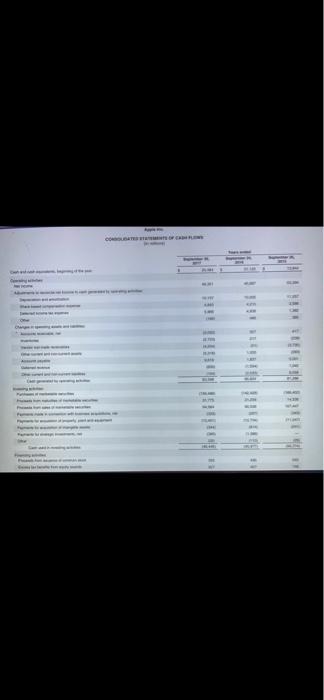
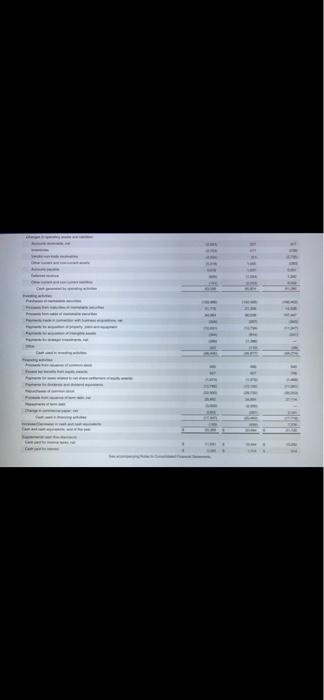
Make a 5-year trend analysis, using 2013 as the base year, of (1) net sales and (2) net income. (To satisfy this requirement you must access information regarding performance in prior years. This information is provided in the complete annual report available on the company's website.) (Round percentages to O decimal places, eg, 15% and enter amounts in millions.) APPLE INC. Trend Analysis of Net Sales and Net Earnings For the Five Years Ended 2017 2017 2016 2015 $ 229234 215639 233715 (1) Net sales 134 126 Trend % 137 % $ (2) Net income 48351 45687 53394 Trend 131 % 123 % 144 Make a 5-year trend analysis, using 2013 as the base year, of (1) net sales and (2) net income. (To satisfy this requirement you must access information regarding performance in prior years. This information is provided in the complete annual report available on the company's website.) (Round percentages to O decimal places, eg. 15% and enter amounts in millions.) 2015 2014 2013 $ $ 170910 215639 233715 182795 107 100 126 137 X %6 % 39510 37037 45687 53394 107 100 % %6 123 144 %6 % % (51) Compute for 2017 and 2016 the (1) debt to assets ratio and (2) times interest earned. (Round percentages to decimal places, es 15% and times to 1 decimal place, eg. 152) 2017 2016 % % Debt to Assets Ratio times times Times Interest Earned opend Specimen France Arple 11 B fil E ti 2 130 COLORE LA GREECE Bust! 11 - il T 11 Te al tiisi Hill 111 Make a 5-year trend analysis, using 2013 as the base year, of (1) net sales and (2) net income. (To satisfy this requirement you must access information regarding performance in prior years. This information is provided in the complete annual report available on the company's website.) (Round percentages to O decimal places, eg, 15% and enter amounts in millions.) APPLE INC. Trend Analysis of Net Sales and Net Earnings For the Five Years Ended 2017 2017 2016 2015 $ 229234 215639 233715 (1) Net sales 134 126 Trend % 137 % $ (2) Net income 48351 45687 53394 Trend 131 % 123 % 144 Make a 5-year trend analysis, using 2013 as the base year, of (1) net sales and (2) net income. (To satisfy this requirement you must access information regarding performance in prior years. This information is provided in the complete annual report available on the company's website.) (Round percentages to O decimal places, eg. 15% and enter amounts in millions.) 2015 2014 2013 $ $ 170910 215639 233715 182795 107 100 126 137 X %6 % 39510 37037 45687 53394 107 100 % %6 123 144 %6 % % (51) Compute for 2017 and 2016 the (1) debt to assets ratio and (2) times interest earned. (Round percentages to decimal places, es 15% and times to 1 decimal place, eg. 152) 2017 2016 % % Debt to Assets Ratio times times Times Interest Earned opend Specimen France Arple 11 B fil E ti 2 130 COLORE LA GREECE Bust! 11 - il T 11 Te al tiisi Hill 111 


Step by Step Solution
There are 3 Steps involved in it
Step: 1

Get Instant Access to Expert-Tailored Solutions
See step-by-step solutions with expert insights and AI powered tools for academic success
Step: 2

Step: 3

Ace Your Homework with AI
Get the answers you need in no time with our AI-driven, step-by-step assistance
Get Started


