I would really appreciate your help with this assignment! Resources Needed to Complete Analysis Use the Target Corporation's Form 10-K to complete the case. You
I would really appreciate your help with this assignment!
Resources Needed to Complete Analysis
Use the Target Corporation's Form 10-K to complete the case. You will be working with Target's two most recent fiscal year Annual Reports. You can pull the two most recent Annual Reports from this link:Target Annual Reports.
Target's Form 10-K is available on the company's website or through theSEC's EDGAR database.
How to use EDGAR:EDGAR Guide
Access Project Excel template from Canvas
Access Project Written Analysis template from Canvas
Access latest industry information from the IBISWorld Industry Market Research Database within the college library.
Visit my.baker.edu
Select "Department Resources"
Select Academic Resource Center
Click on the "Library" icon
Click on the "Articles & Databases" icon
Scroll down to the business databases and select IBISWorld Industry Market Research
Enter Library number (if asked)
In the search box type Target's NAICS Code: 45211
Select "45211 - Department Stores in the US Industry Report"
Scroll down and select under "Major Players" Target Corporation
Use the information here for industry performance for competitors of Target for analysis
Please be sure to show all support for your work. You will be using the following sections of the annual report: MD&A, consolidated financial statements and notes to the financial statements.
Fill in the following tabs in the Excel template:
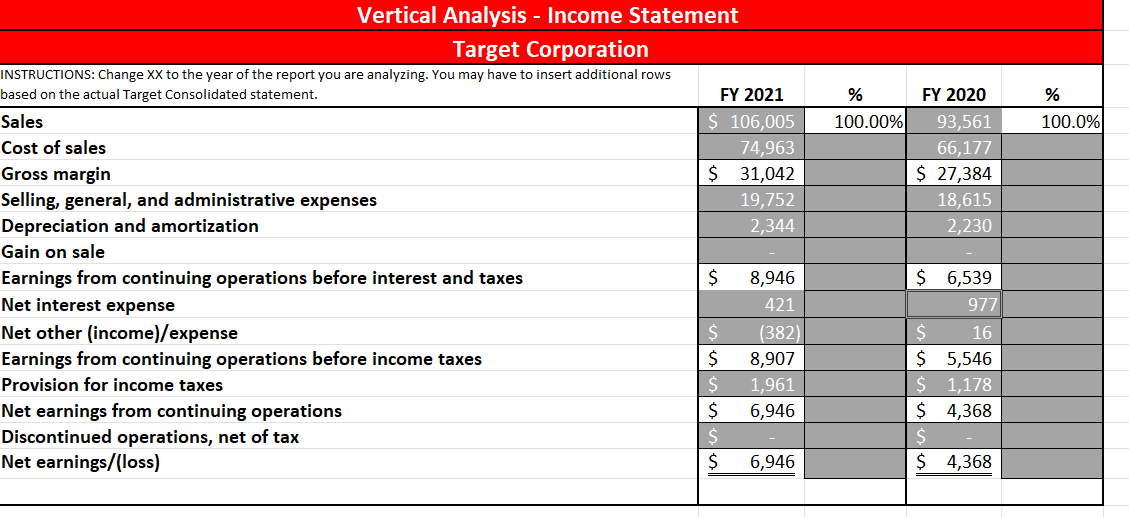
Vertical Analysis - Income Statements
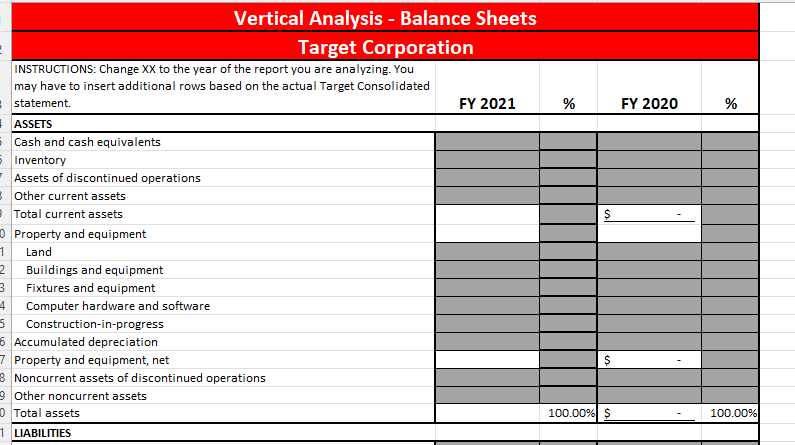
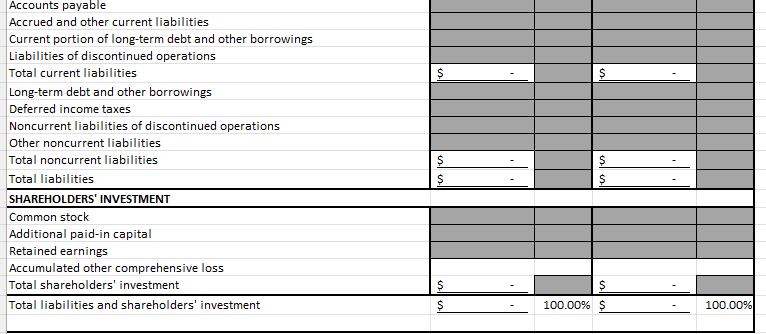
Vertical Analysis - Balance Sheets
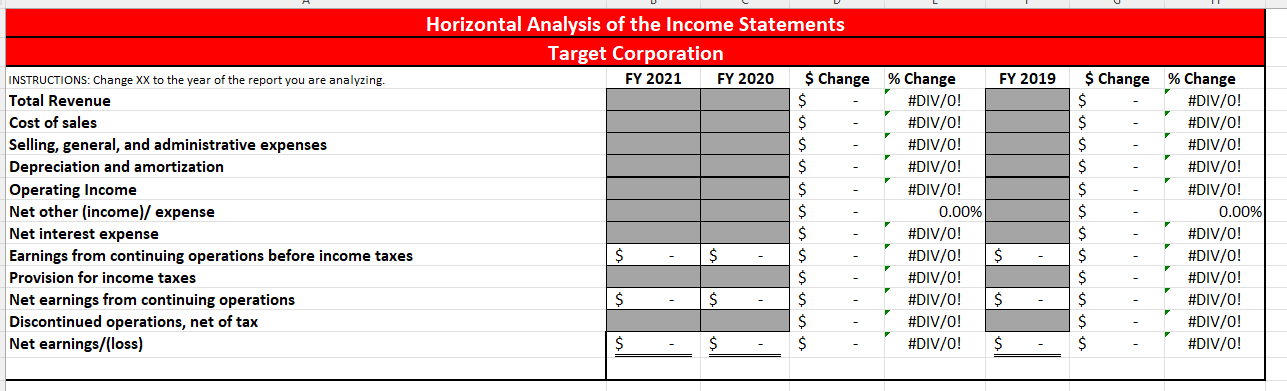
Horizontal Analysis - Income Statements
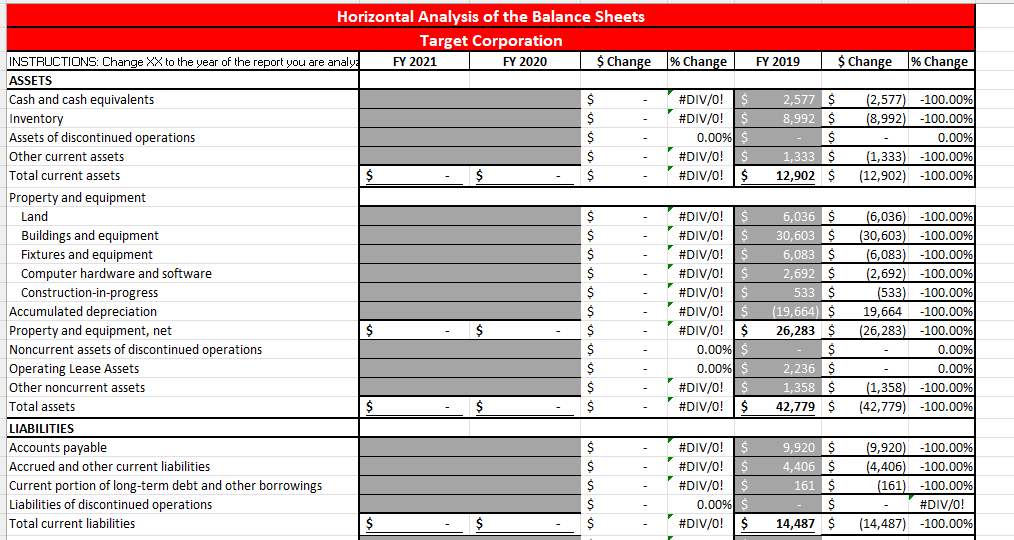
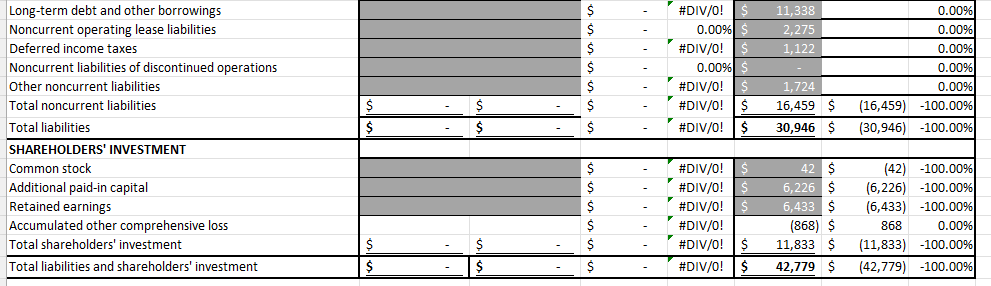
Horizontal Analysis - Balance Sheets
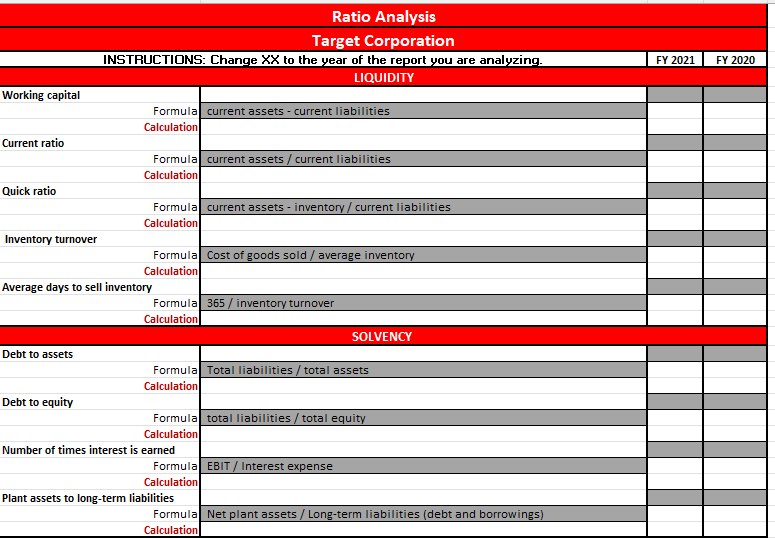
Section 2. Ratio Analysis (35 points)
Identify the appropriate formula and calculate the following ratios for the most recent two fiscal years (Market performance ratios (earnings per share, book value per share, price-earnings ratio, and dividend yield are already computed and included in the template.)
NOTE: You will need to use the previous year's reports in order to calculate averages where applicable.
Complete the following ratios in the Excel template:
Measures of liquidity
Working capital
Current ratio
Quick ratio
Inventory turnover
Average days to sell inventory
Measures of solvency
Debt to assets
Debt to equity
Number of times interest earned
Plant assets to long-term liabilities
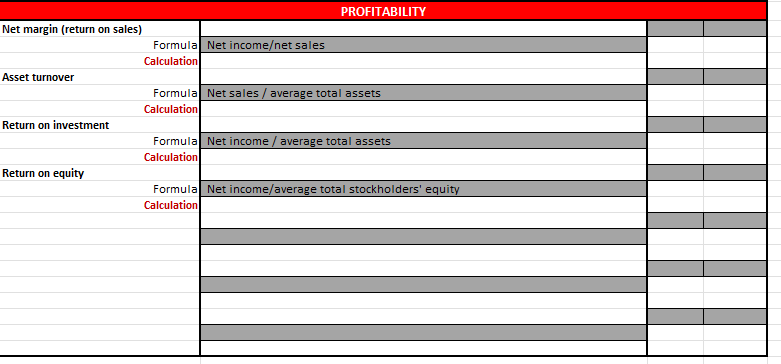
Measures of profitability
Net margin (return on sales)
Asset turnover
Return on investment
Return on equity
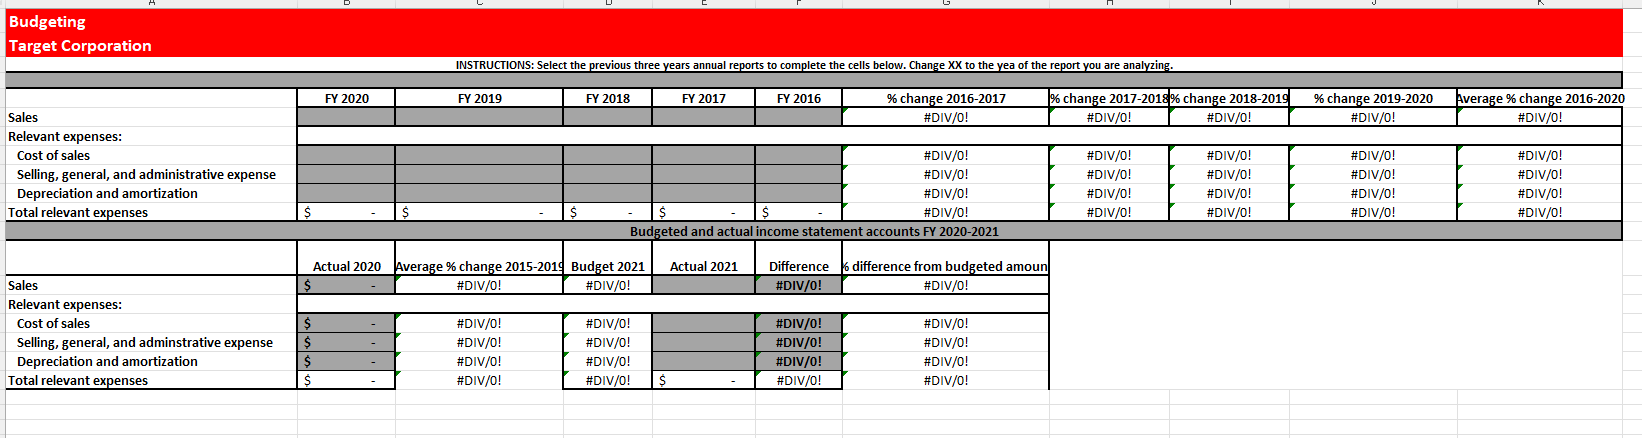
Section 3. Budgeting (20 points)
In this section visitTarget Annual Reports to access the previous three years annual reports NOT including the two fiscal years you have analyzed to calculate the following in the template.
Calculate the percentage change for each of the following categories of revenues and expenses the recent two fiscal years.
Calculate the average percentage change
Use the most recent two years data and the average percentage change calculated in Section 1 to set up a budget for last year.
Vertical Analysis - Income Statement Target Corporation INSTRUCTIONS: Change XX to the year of the report you are analyzing. You may have to insert additional rows based on the actual Target Consolidated statement. FY 2021 % FY 2020 % Sales $ 106,005 100.00% 93,561 100.0% Cost of sales 74,963 66,177 Gross margin $ 31,042 $ 27,384 Selling, general, and administrative expenses 19,752 18,615 Depreciation and amortization 2,344 2,230 Gain on sale Earnings from continuing operations before interest and taxes S 8,946 $ 6,539 Net interest expense 421 977 Net other (income)/ expense S (382 S 16 Earnings from continuing operations before income taxes S 8,907 $ 5,546 Provision for income taxes S 1,961 S 1,178 Net earnings from continuing operations S 6,946 $ 4,368 Discontinued operations, net of tax S Net earnings/(loss) S 6,946 S 4,368Vertical Analysis - Balance Sheets Target Corporation INSTRUCTIONS: Change XX to the year of the report you are analyzing. You may have to insert additional rows based on the actual Target Consolidated statement. FY 2021 % FY 2020 % ASSETS Cash and cash equivalents Inventory Assets of discontinued operations Other current assets Total current assets Property and equipment Land Buildings and equipment Fixtures and equipment Computer hardware and software Construction-in-progress Accumulated depreciation Property and equipment, net S Noncurrent assets of discontinued operations Other noncurrent assets Total assets 100.00% S 100.00% LIABILITIESAccounts payable Accrued and other current liabilities Current portion of long-term debt and other borrowings Liabilities of discontinued operations Total current liabilities S Long-term debt and other borrowings Deferred income taxes Noncurrent liabilities of discontinued operations Other noncurrent liabilities Total noncurrent liabilities Total liabilities SHAREHOLDERS' INVESTMENT Common stock Additional paid-in capital Retained earnings Accumulated other comprehensive loss Total shareholders' investment Total liabilities and shareholders' investment 100.00% S 100.00%Horizontal Analysis of the Income Statements Target Corporation INSTRUCTIONS: Change XX to the year of the report you are analyzing. FY 2021 FY 2020 $ Change % Change FY 2019 $ Change % Change Total Revenue #DIV/O! #DIV/O! Cost of sales #DIV/O! #DIV/O! Selling, general, and administrative expenses #DIV/O! #DIV/O! Depreciation and amortization #DIV/O! #DIV/O! Operating Income #DIV/O! #DIV/O! Net other (income)/ expense 0.00% 0.00% Net interest expense #DIV/O! #DIV/O! Earnings from continuing operations before income taxes S - #DIV/O! S #DIV/O! Provision for income taxes #DIV/O! #DIV/O! Net earnings from continuing operations S - #DIV/O! S #DIV/O! Discontinued operations, net of tax #DIV/O! #DIV/O! Net earnings/(loss) $ #DIV/O! S #DIV/O!Horizontal Analysis of the Balance Sheets Target Corporation INSTRUCTIONS: Change XX to the year of the report you are analyz FY 2021 FY 2020 $ Change % Change FY 2019 $ Change % Change ASSETS Cash and cash equivalents #DIV/O! 2,577 $ (2,577) -100.0096 Inventory #DIV/O! S 8,992 S (8,992 -100.00% Assets of discontinued operations 0.00% S 0.00% Other current assets #DIV/O! S 1,333 (1,333) -100.0096 Total current assets $ $ #DIV/O! $ 12,902 S (12,902) -100.00% Property and equipment Land #DIV/O! 6,036 S (6,036) -100.00% Buildings and equipment #DIV/O! S 30,603 S (30,603) -100.00% Fixtures and equipment #DIV/O! 6,083 S (6,083 -100.00% Computer hardware and software #DIV/O! 2,692 (2,692) -100.00% Construction-in-progress #DIV/O! S 533 S 533 -100.00% Accumulated depreciation #DIV/O! (19,664) S 19,664 -100.00% Property and equipment, net - #DIV/O! S 26,283 (26,283 -100.00% Noncurrent assets of discontinued operations 0.00% S S 0.00% Operating Lease Assets 0.00% 2,236 S 0.00% Other noncurrent assets #DIV/O! S 1,358 (1,358) -100.00% Total assets $ #DIV/O! $ 42,779 S (42,779) -100.00% LIABILITIES Accounts payable #DIV/O! 9,920 $ (9,920) -100.00% Accrued and other current liabilities #DIV/O! S 4,406 (4,406 -100.00% Current portion of long-term debt and other borrowings #DIV/O! 161 161) -100.00% Liabilities of discontinued operations 0.00% #DIV/O! Total current liabilities S - #DIV/O! S 14,487 S (14,487) -100.00%Long-term debt and other borrowings #DIV/O! S 11,338 0.00% Noncurrent operating lease liabilities 0.00% S 2,275 0.009% Deferred income taxes #DIV/O! S 1,122 0.00% Noncurrent liabilities of discontinued operations - 0.00% S 0.009% Other noncurrent liabilities #DIV/O! LO 1,724 0.00% Total noncurrent liabilities #DIV/O! 16,459 $ (16,459) -100.00% Total liabilities S #DIV/O! $ 30,946 $ (30,946) -100.00% SHAREHOLDERS' INVESTMENT Common stock #DIV/O! 42 (42) -100.006 Additional paid-in capital #DIV/O! S 6,226 (6,226) -100.00% Retained earnings #DIV/O! S 6,433 (6,433) -100.00% Accumulated other comprehensive loss #DIV/O! (868) 868 0.00% Total shareholders' investment #DIV/O! S 11,833 S (11,833) -100.00% Total liabilities and shareholders' investment #DIV/O! 42,779 S (42,779) -100.00%Ratio Analysis Target Corporation INSTRUCTIONS: Change XX to the year of the report you are analyzing. FY 2021 FY 2020 LIQUIDITY Working capital Formula current assets - current liabilities Calculation Current ratio Formula current assets / current liabilities Calculation Quick ratio Formula current assets - inventory / current liabilities Calculation Inventory turnover Formula Cost of goods sold / average inventory Calculation Average days to sell inventory Formula 365 / inventory turnover Calculation SOLVENCY Debt to assets Formula Total liabilities / total assets Calculation Debt to equity Formula total liabilities / total equity Calculation Number of times interest is earned Formula EBIT / Interest expense Calculation Plant assets to long-term liabilities Formula Net plant assets / Long-term liabilities (debt and borrowings) CalculationPROFITABILITY Net margin (return on sales) Formula Net incomeet sales Calculation Asset turnover Formula Net sales / average total assets Calculation Return on investment Formula Net income / average total assets Calculation Return on equity Formula Net income/ average total stockholders' equity CalculationBudgeting Target Corporation INSTRUCTIONS: Select the previous three years annual reports to complete the cells below. Change XX to the yea of the report you are analyzing. FY 2020 FY 2019 FY 2018 FY 2017 FY 2016 6 change 2016-2017 % change 2017-2018% change 2018-2019 % change 2019-2020 Average % change 2016-2020 Sales #DIV/O! #DIV/O! #DIV/O! #DIV/O! #DIV/0! Relevant expenses: Cost of sales #DIV/O! #DIV/O! #DIV/O! #DIV/O! #DIV/O! Selling, general, and administrative expense #DIV/O! #DIV/O! #DIV/O! #DIV/O! #DIV/O! Depreciation and amortization #DIV/O! #DIV/O! #DIV/O! #DIV/O! #DIV/O! Total relevant expenses $ #DIV/O! #DIV/O! #DIV/O! #DIV/O! #DIV/O! Budgeted and actual income statement accounts FY 2020-2021 Actual 2020 Average % change 2015-2019 Budget 2021 Actual 2021 Difference 6 difference from budgeted amoun Sales S #DIV/0 #DIV/O! #DIV/0! #DIV/0 Relevant expenses: Cost of sales #DIV/O! #DIV/O! #DIV/O! #DIV/O! Selling, general, and adminstrative expense #DIV/O! #DIV/O! #DIV/O! #DIV/O! Depreciation and amortization #DIV/O! #DIV/O! #DIV/O! #DIV/O! Total relevant expenses #DIV/O! #DIV/O! $ #DIV/O! #DIV/O
Step by Step Solution
There are 3 Steps involved in it
Step: 1
Get Instant Access to Expert-Tailored Solutions
See step-by-step solutions with expert insights and AI powered tools for academic success
Step: 2
Step: 3
Ace Your Homework with AI
Get the answers you need in no time with our AI-driven, step-by-step assistance