Answered step by step
Verified Expert Solution
Question
1 Approved Answer
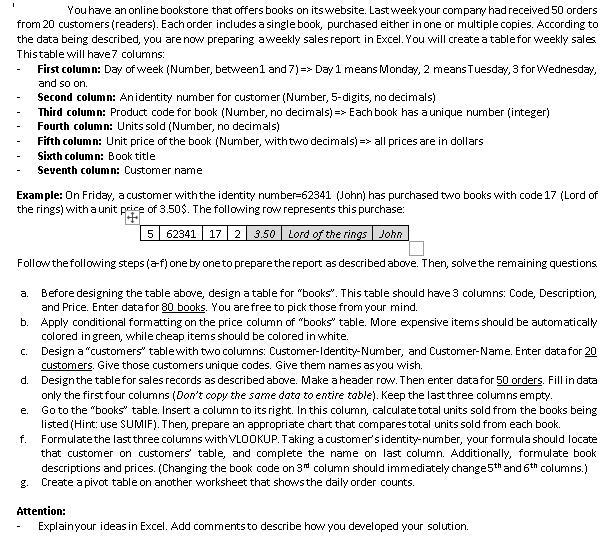
I You have an online bookstore that offers books on its website. Last week your company had received 50 orders from 20 customers (readers).

I You have an online bookstore that offers books on its website. Last week your company had received 50 orders from 20 customers (readers). Each order includes a single book, purchased either in one or multiple copies. According to the data being described, you are now preparing a weekly sales report in Excel. You will create a table for weekly sales This table will have 7 columns: First column: Day of week (Number, between1 and 7) => Day 1 means Monday, 2 meansTuesday, 3 for Wednesday, and so on. Example: On Friday, a customer with the identity number-62341 (John) has purchased two books with code 17 (Lord of the rings) with a unit price of 3.50$. The following row represents this purchase: 5 62341 17 2 3.50 Lord of the rings John Follow the following steps (af) one by one to prepare the report as described above. Then, solve the remaining questions. e. Second column: An identity number for customer (Number, 5-digits, no decimals) Third column: Product code for book (Number, no decimals) => Each book has a unique number (integer) Fourth column: Units sold (Number, no decimals) Fifth column: Unit price of the book (Number, with two decimals) => all prices are in dollars Sixth column: Book title Seventh column: Customer name a. Before designing the table above, design a table for "books". This table should have 3 columns: Code, Description, and Price. Enter data for 80 books. You are free to pick those from your mind. b. Apply conditional formatting on the price column of "books" table. More expensive items should be automatically colored in green, while cheap items should be colored in white. c. Design a "customers" table with two columns: Customer-Identity-Number, and Customer-Name. Enter data for 20 customers. Give those customers unique codes. Give them names as you wish. d. Design the table for sales records as described above. Make a header row. Then enter data for 50 orders. Fill in data only the first four columns (Don't copy the same data to entire table). Keep the last three columns empty. Go to the "books" table. Insert a column to its right. In this column, calculate total units sold from the books being listed (Hint: use SUMIF). Then, prepare an appropriate chart that compares total units sold from each book. Formulate the last three columns with VLOOKUP. Taking a customer's identity-number, your formula should locate that customer on customers' table, and complete the name on last column. Additionally, formulate book descriptions and prices. (Changing the book code on 3rd column should immediately change 5th and 6th columns.) Create a pivot table on another worksheet that shows the daily order counts. f. Attention: Explain your ideas in Excel. Add comments to describe how you developed your solution.
Step by Step Solution
There are 3 Steps involved in it
Step: 1

Get Instant Access to Expert-Tailored Solutions
See step-by-step solutions with expert insights and AI powered tools for academic success
Step: 2

Step: 3

Ace Your Homework with AI
Get the answers you need in no time with our AI-driven, step-by-step assistance
Get Started


