IBM2010 ACCOUNTING AND FINANCIAL MANAGEMENT ASSIGNMENT : PLANNING, BUDGETING AND CONTROLLING
Submit as group through blackboard (upload as pdf copy) and make sure to include your group number( such as Team 1, Team 2 ) , course ID, all student names and ID
Q1 . 5 pts
With the following information,
prepare an operating budget for one of CompuTechs departments for 2014. The operating results
for 2013 for this department are as follows:
Revenue Cost of sales Gross profit Salaries Profit $
Q 2. 10 pts
$32,400 (21,600) 10,800
(8,000) 2,800
In 2013, the department sold 5,400 units and the retail sales price per unit was $6.00. The purchase
price per unit was $4.00. A portion of the salaries, $8,000, was allocated to that department. Both the
controller and the sales manager made planning assumptions for the 2014 budget year. They
projected a 6% increase in the number of units to be sold and that both the selling price cost of sales
would increase by 2%. Salaries will show an 8% increase.
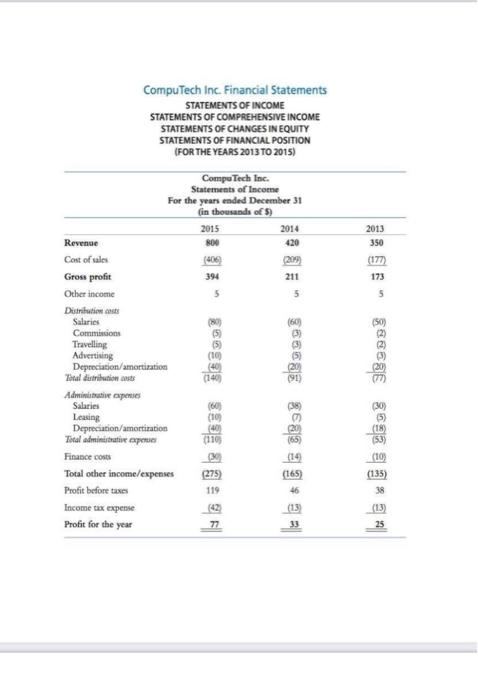
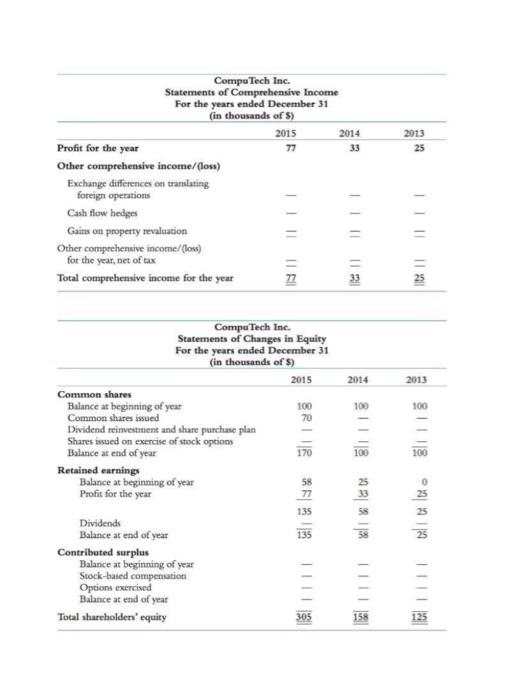
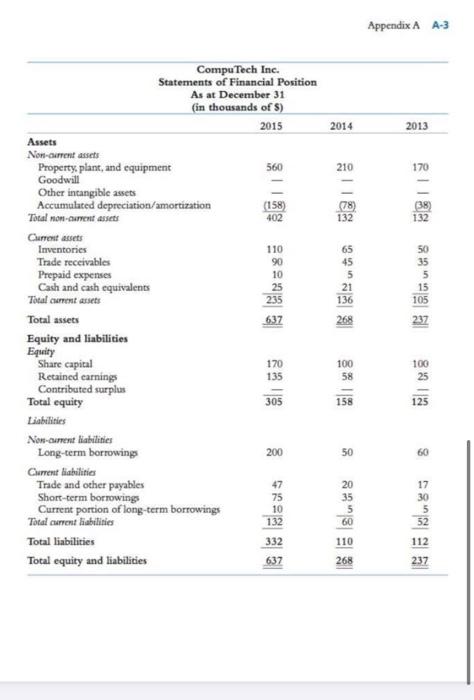
Financial Indicators Use CompuTechs financial statements for 2014 in Appendix A to calculate the following:
1. The companys sustainable growth rate 2. The companys Z-score
CompuTech Inc. Financial Statements STATEMENTS OF INCOME STATEMENTS OF COMPREHENSIVE INCOME STATEMENTS OF CHANGES IN EQUITY STATEMENTS OF FINANCIAL POSITION (FOR THE YEARS 2013 TO 2015) 300 2013 350 (177) 173 5 (50) CompuTech Inc. Statements of Income For the years ended December 31 in thousands of 5) 2015 2014 Revenue 420 Cost of sales (406 (209 Gross profit 394 211 Other income 5 5 Distributions Salaries Commission Travelling Advertising Depreciation/amortization Total distributions Adminibus aperties Salaries 160 Leasing Depreciation/amortization Total administrative per Finance costs (14 Total other income/expenses (275) (165) Profit before totes 119 46 Income tax expensie (1.3 Profit for the year 77 TED 88 36868 868 232 | (18) (10) (135) 38 25 2013 25 CompuTech Inc. Statements of Comprehensive Income For the years ended December 31 (in thousands of 5) 2015 2014 Profit for the year 77 33 Other comprehensive income/(loss) Exchange differences on translating foreign operations Cash flow hedges Gainus on property revaluation Other comprehensive income/(low) for the year, net of tax Total comprehensive income for the year INII 11 111111 II III 2014 2013 100 100 100 CompuTech Inc. Statements of Changes in Equity For the years ended December 31 (in thousands of $) 2015 Common shares Balance at beginning of year 100 Common shares issued 70 Dividend reinvestment and share purchase plan Shares issued on exercise of stock options Balance at end of year 170 Retained earnings Balance at beginning of year 58 Profit for the year 77 135 Dividends Balance at end of year 135 Contributed surplus Balance at beginning of year Stock-based compensation Options exercised Balance at end of year Total shareholders' equity 305 25 33 58 158 Appendix A A-3 2014 2013 210 (38) 132 132 50 35 45 5 21 136 15 105 CompuTech Inc. Statements of Financial Position As at December 31 (in thousands of s) 2015 Assets Non-current assets Property, plant, and equipment 560 Goodwill Other intangible assets Accumulated depreciation/amortization (158) Total non-current assets 402 Current assets Inventories 110 Trade receivables 90 Prepaid expenses 10 Cash and cash equivalents 25 Tocal current assets 235 Total assets 637 Equity and liabilities Equity Share capital 170 Retained earnings 135 Contributed surplus Total equity 305 Liabilities Now-current liabilities Long-term borrowings 200 Current liabilities Trade and other payables Short-term borrowing Current portion of long-term borrowings 10 Total current liabilities 132 Total liabilities Total equity and liabilities 268 100 58 100 25 125 158 50 60 20 35 17 30 52 332 60 110 268 112 637 237 CompuTech Inc. Financial Statements STATEMENTS OF INCOME STATEMENTS OF COMPREHENSIVE INCOME STATEMENTS OF CHANGES IN EQUITY STATEMENTS OF FINANCIAL POSITION (FOR THE YEARS 2013 TO 2015) 300 2013 350 (177) 173 5 (50) CompuTech Inc. Statements of Income For the years ended December 31 in thousands of 5) 2015 2014 Revenue 420 Cost of sales (406 (209 Gross profit 394 211 Other income 5 5 Distributions Salaries Commission Travelling Advertising Depreciation/amortization Total distributions Adminibus aperties Salaries 160 Leasing Depreciation/amortization Total administrative per Finance costs (14 Total other income/expenses (275) (165) Profit before totes 119 46 Income tax expensie (1.3 Profit for the year 77 TED 88 36868 868 232 | (18) (10) (135) 38 25 2013 25 CompuTech Inc. Statements of Comprehensive Income For the years ended December 31 (in thousands of 5) 2015 2014 Profit for the year 77 33 Other comprehensive income/(loss) Exchange differences on translating foreign operations Cash flow hedges Gainus on property revaluation Other comprehensive income/(low) for the year, net of tax Total comprehensive income for the year INII 11 111111 II III 2014 2013 100 100 100 CompuTech Inc. Statements of Changes in Equity For the years ended December 31 (in thousands of $) 2015 Common shares Balance at beginning of year 100 Common shares issued 70 Dividend reinvestment and share purchase plan Shares issued on exercise of stock options Balance at end of year 170 Retained earnings Balance at beginning of year 58 Profit for the year 77 135 Dividends Balance at end of year 135 Contributed surplus Balance at beginning of year Stock-based compensation Options exercised Balance at end of year Total shareholders' equity 305 25 33 58 158 Appendix A A-3 2014 2013 210 (38) 132 132 50 35 45 5 21 136 15 105 CompuTech Inc. Statements of Financial Position As at December 31 (in thousands of s) 2015 Assets Non-current assets Property, plant, and equipment 560 Goodwill Other intangible assets Accumulated depreciation/amortization (158) Total non-current assets 402 Current assets Inventories 110 Trade receivables 90 Prepaid expenses 10 Cash and cash equivalents 25 Tocal current assets 235 Total assets 637 Equity and liabilities Equity Share capital 170 Retained earnings 135 Contributed surplus Total equity 305 Liabilities Now-current liabilities Long-term borrowings 200 Current liabilities Trade and other payables Short-term borrowing Current portion of long-term borrowings 10 Total current liabilities 132 Total liabilities Total equity and liabilities 268 100 58 100 25 125 158 50 60 20 35 17 30 52 332 60 110 268 112 637 237