I'd like to ask for the error in this coding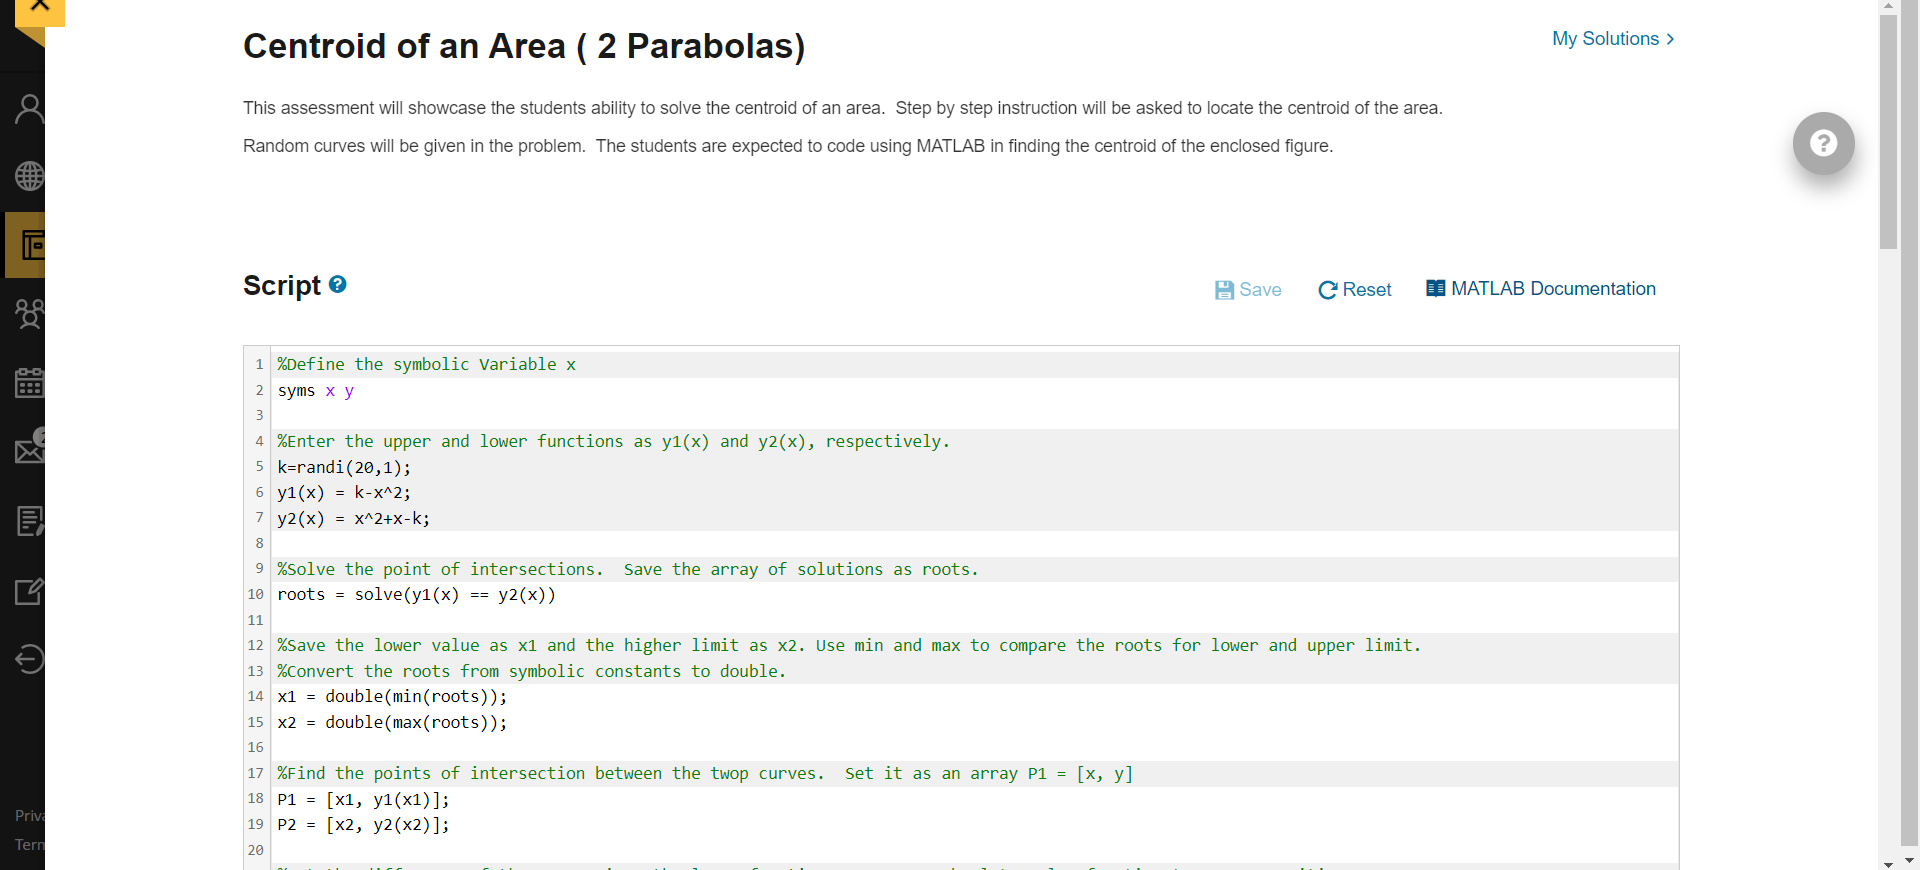
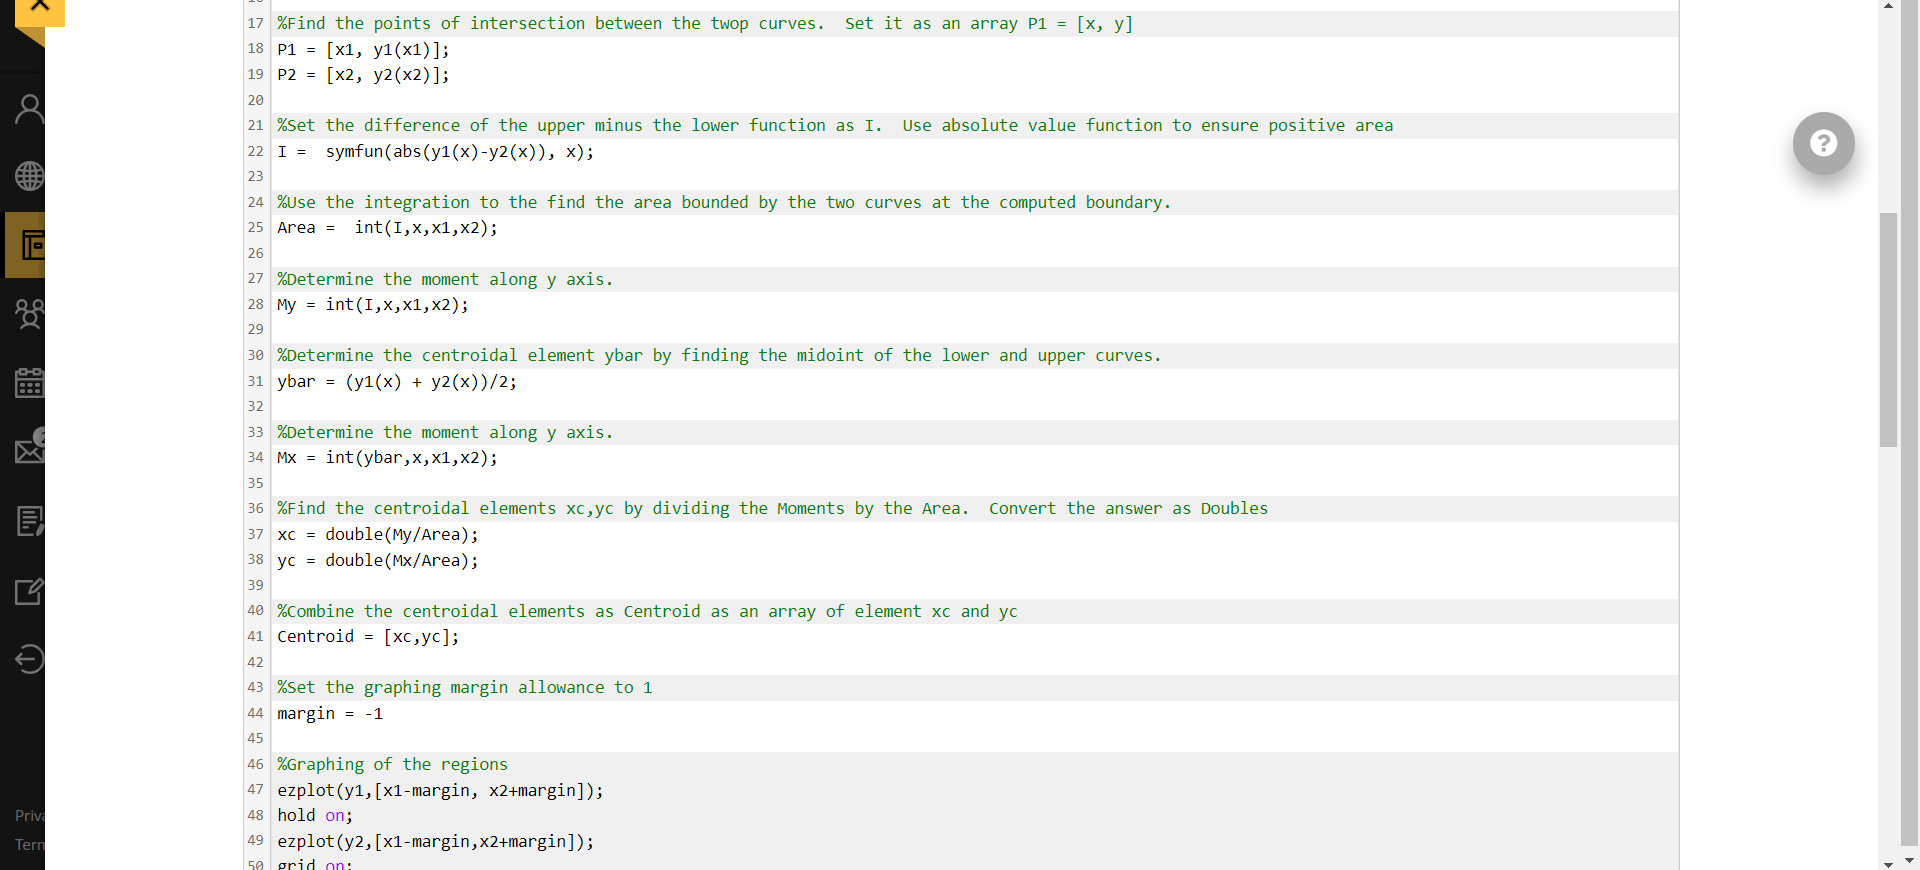
Centrold o an Area ( 2 Parapolas) This assessment will showcase the students ability to solve the centroid of an area. Step by step instruction will be asked to locate the centroid of the area. Random curves will be given in the problem. The students are expected to code using MATLAB in finding the centroid of the enclosed figure. Script 8 MATLAB Documentation 17 \% Find the points of intersection between the twop curves. Set it as an array P1=[x,y] \%set the difference of the upper minus the lower function as I. Use absolute value function to ensure positive area I=symfun(abs(y1(x)y2(x)),x); \%Use the integration to the find the area bounded by the two curves at the computed boundary. Area =int(I,x,x1,x2); \%Determine the moment along y axis. My =int(I,x,x1,x2); \%Determine the centroidal element ybar by finding the midoint of the lower and upper curves. y bar =(y1(x)+y2(x))/2 \%Determine the moment along y axis. Mx=int(ybar,x,x1,x2) \%Find the centroidal elements xc, yc by dividing the Moments by the Area. Convert the answer as Doubles xc= double(My/Area); yc= double (Mx/ Area ); \%combine the centroidal elements as centroid as an array of element xc and yc Centroid =[xc,yc]; \%set the graphing margin allowance to 1 margin =1 \% Graphing of the regions ezplot(y1, [x1-margin, x2+margin]); hold on; ezplot(y2, [x1-margin,x2+margin]); Centrold o an Area ( 2 Parapolas) This assessment will showcase the students ability to solve the centroid of an area. Step by step instruction will be asked to locate the centroid of the area. Random curves will be given in the problem. The students are expected to code using MATLAB in finding the centroid of the enclosed figure. Script 8 MATLAB Documentation 17 \% Find the points of intersection between the twop curves. Set it as an array P1=[x,y] \%set the difference of the upper minus the lower function as I. Use absolute value function to ensure positive area I=symfun(abs(y1(x)y2(x)),x); \%Use the integration to the find the area bounded by the two curves at the computed boundary. Area =int(I,x,x1,x2); \%Determine the moment along y axis. My =int(I,x,x1,x2); \%Determine the centroidal element ybar by finding the midoint of the lower and upper curves. y bar =(y1(x)+y2(x))/2 \%Determine the moment along y axis. Mx=int(ybar,x,x1,x2) \%Find the centroidal elements xc, yc by dividing the Moments by the Area. Convert the answer as Doubles xc= double(My/Area); yc= double (Mx/ Area ); \%combine the centroidal elements as centroid as an array of element xc and yc Centroid =[xc,yc]; \%set the graphing margin allowance to 1 margin =1 \% Graphing of the regions ezplot(y1, [x1-margin, x2+margin]); hold on; ezplot(y2, [x1-margin,x2+margin])