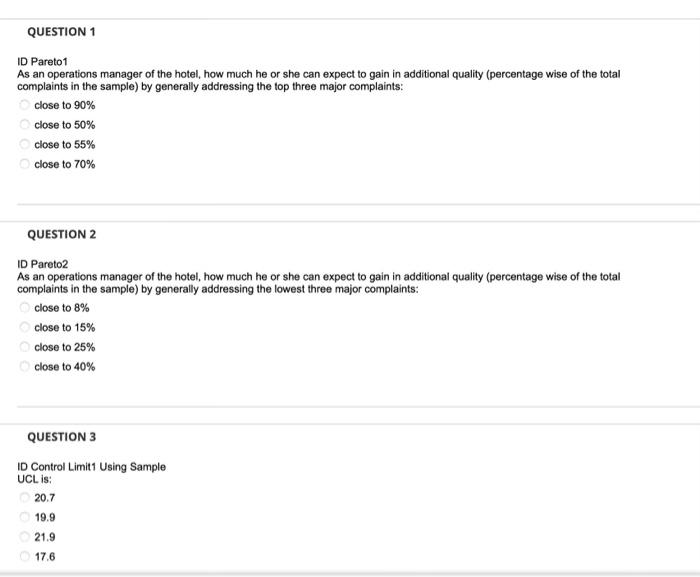
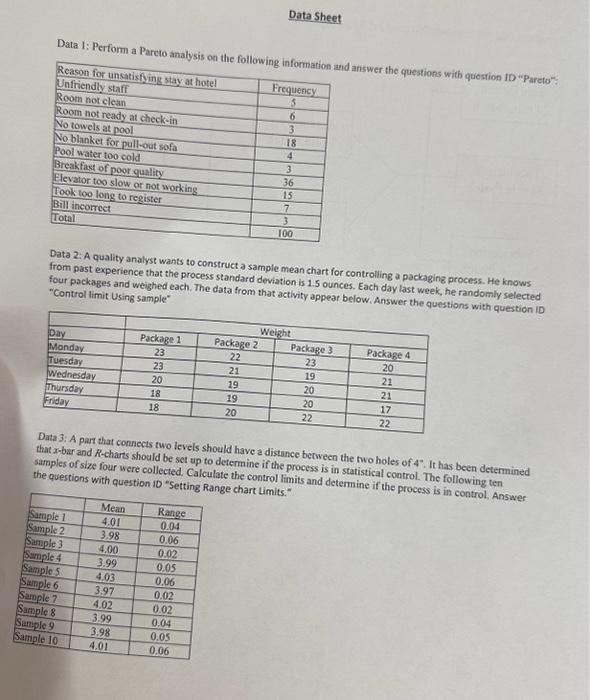
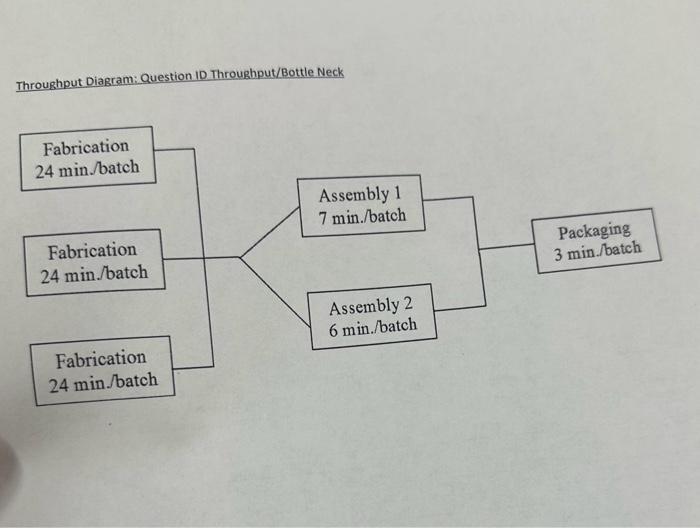
ID Pareto1 As an operations manager of the hotel, how much he or she can expect to gain in additional quality (percentage wise of the total complaints in the sample) by generally addressing the top three major complaints: close to 90% close to 50% close to 55% close to 70% QUESTION 2 ID Pareto2 As an operations manager of the hotel, how much he or she can expect to gain in additional quality (percentage wise of the total complaints in the sample) by generally addressing the lowest three major complaints: close to 8% close to 15% close to 25% close to 40% QUESTION 3 ID Control Limit1 Using Sample UCL is: 20.7 19.9 21.9 17.6 Data 1: Perform a Pareto analuei............ Ad answer the questions with question ID "Pareto": Data 2: A quality analyst wants to construct a sample mean chart for controlling a packaging process. He knows four packages and we that the process standard deviation is 1.5 ounces. Each day last week, he randomly selected "Control limit Using sample" Data 3: A part that connects two levels should have a distance between the two holes of 4. It has been determined that x-bar and R-charts should be set up to determine if the process is in statistical control. The following ten the questions with question id " setting Range chantrol limits and determine if the process is in control. Answer Throughput Diagram: Question ID Throughput/Bottle Neck ID Pareto1 As an operations manager of the hotel, how much he or she can expect to gain in additional quality (percentage wise of the total complaints in the sample) by generally addressing the top three major complaints: close to 90% close to 50% close to 55% close to 70% QUESTION 2 ID Pareto2 As an operations manager of the hotel, how much he or she can expect to gain in additional quality (percentage wise of the total complaints in the sample) by generally addressing the lowest three major complaints: close to 8% close to 15% close to 25% close to 40% QUESTION 3 ID Control Limit1 Using Sample UCL is: 20.7 19.9 21.9 17.6 Data 1: Perform a Pareto analuei............ Ad answer the questions with question ID "Pareto": Data 2: A quality analyst wants to construct a sample mean chart for controlling a packaging process. He knows four packages and we that the process standard deviation is 1.5 ounces. Each day last week, he randomly selected "Control limit Using sample" Data 3: A part that connects two levels should have a distance between the two holes of 4. It has been determined that x-bar and R-charts should be set up to determine if the process is in statistical control. The following ten the questions with question id " setting Range chantrol limits and determine if the process is in control. Answer Throughput Diagram: Question ID Throughput/Bottle Neck