

Answered step by step
Verified Expert Solution
Question
1 Approved Answer
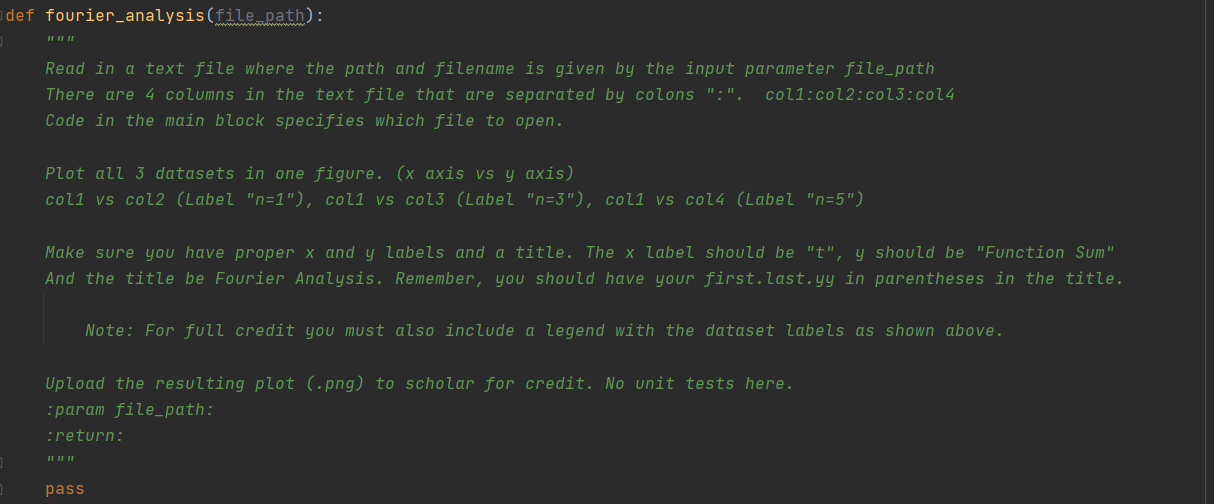
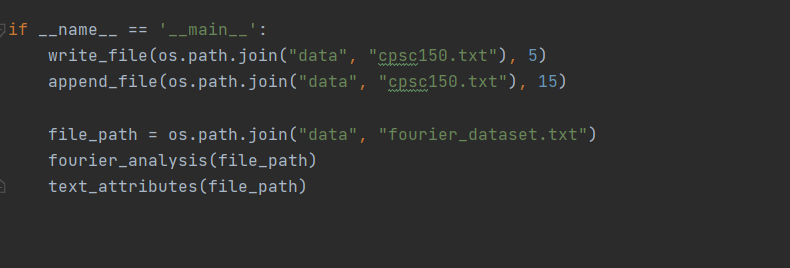
idef fourier_analysis(filepath): Read in a text file where the path and filename is given by the input parameter file_path There are 4 columns in the
Step by Step Solution
There are 3 Steps involved in it
Step: 1

Get Instant Access to Expert-Tailored Solutions
See step-by-step solutions with expert insights and AI powered tools for academic success
Step: 2

Step: 3
Ace Your Homework with AI
Get the answers you need in no time with our AI-driven, step-by-step assistance
Get Started
Database Programming With Visual Basic .NET
Authors: Carsten Thomsen
2nd Edition
1590590325, 978-1590590324