

Answered step by step
Verified Expert Solution
Question
1 Approved Answer
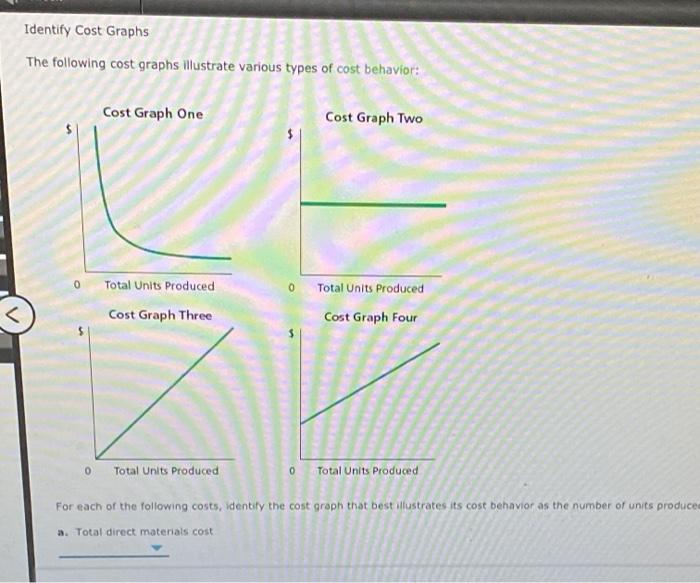
Identify Cost Graphs The following cost graphs illustrate various types of cost behavior: Cost Graph One Cost Graph Two 0 Total Units Produced Total Units

Step by Step Solution
There are 3 Steps involved in it
Step: 1

Get Instant Access to Expert-Tailored Solutions
See step-by-step solutions with expert insights and AI powered tools for academic success
Step: 2

Step: 3
Ace Your Homework with AI
Get the answers you need in no time with our AI-driven, step-by-step assistance
Get Started
Computer Accounting With QuickBooks Pro 2010
Authors: Donna UlmerDonna Kay
12th Edition
0077408756, 9780077408756