- Identify four different types of equity financing that are available to Cougar Doors.
- Using the resources available to you this week, identify how much equity financing Cougar Doors may need for a new manufacturing plant.
- If Cougar Doors does not or should not take on equity financing and thoroughly justify your opinion.


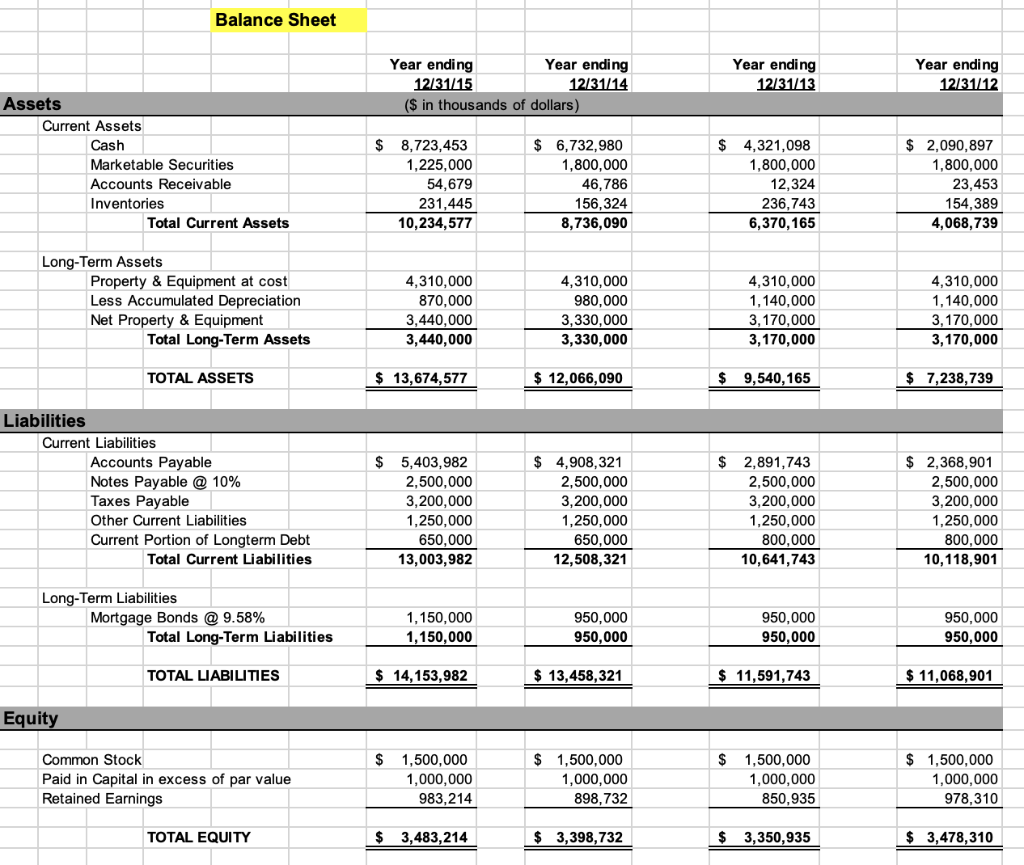
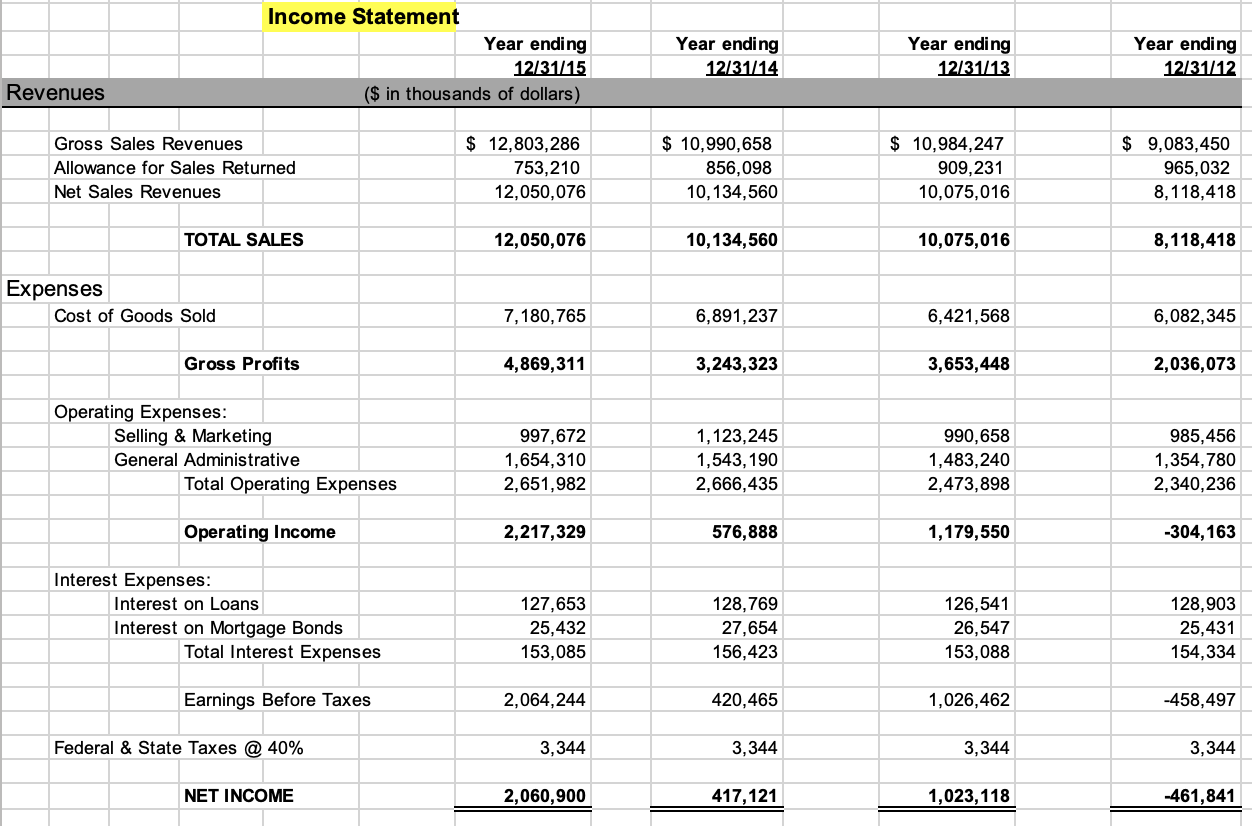
Balance Sheet Year ending Year ending 12/31/15 12/31/14 ($ in thousands of dollars) Year ending 12/31/13 Year ending 12/31/12 Assets Current Assets Cash Marketable Securities Accounts Receivable Inventories Total Current Assets $ 8,723,453 1,225,000 54,679 231,445 10,234,577 $ 6,732,980 1,800,000 46,786 156,324 8,736,090 $ 4,321,098 1,800,000 12,324 236,743 6,370,165 $ 2,090,897 1,800,000 23,453 154,389 4,068,739 Long-Term Assets Property & Equipment at cost Less Accumulated Depreciation Net Property & Equipment Total Long-Term Assets 4,310,000 870,000 3,440,000 3,440,000 4,310,000 980,000 3,330,000 3,330,000 4,310,000 1,140,000 3,170,000 3,170,000 4,310,000 1,140,000 3,170,000 3,170,000 TOTAL ASSETS $ 13,674,577 $ 12,066,090 $ 9,540,165 $ 7,238,739 $ $ Liabilities Current Liabilities Accounts able Notes Payable @ 10% Taxes Payable Other Current Liabilities Current Portion of Longterm Debt Total Current Liabilities 2,500,000 3,200,000 1,250,000 650.000 13,003,982 8,321 2,500,000 3,200,000 1,250,000 650,000 12,508,321 $ 2,891,743 2,500,000 3,200,000 1,250,000 800,000 10,641,743 2,500,000 3,200,000 1,250,000 800,000 10,118,901 Long-Term Liabilities Mortgage Bonds @ 9.58% Total Long-Term Liabilities 1,150,000 1,150,000 950,000 950,000 950,000 950,000 950,000 950,000 TOTAL LIABILITIES $ 14,153,982 $ 13,458,321 $ 11,591,743 $ 11,068,901 Equity $ Common Stock Paid in Capital in excess of par value Retained Earnings $ 1,500,000 1,000,000 983,214 $ 1,500,000 1,000,000 898,732 1,500,000 1,000,000 850,935 $ 1,500,000 1,000,000 978,310 TOTAL EQUITY $ 3,483,214 $ 3,398,732 $ 3,350,935 $ 3,478,310 Income Statement Year ending 12/31/15 ($ in thousands of dollars) Year ending 12/31/14 Year ending 12/31/13 Year ending 12/31/12 Revenues Gross Sales Revenues Allowance for Sales Returned Net Sales Revenues $ 12,803,286 753,210 12,050,076 $ 10,990,658 856,098 10,134,560 $ 10,984,247 909,231 10,075,016 $ 9,083,450 965,032 8,118,418 TOTAL SALES 12,050,076 10,134,560 10,075,016 8,118,418 Expenses Cost of Goods Sold 7,180,765 6,891,237 6,421,568 6,082,345 Gross Profits 4,869,311 3,243,323 3,653,448 2,036,073 Operating Expenses: Selling & Marketing General Administrative Total Operating Expenses 997,672 1,654,310 2,651,982 1,123,245 1,543,190 2,666,435 990,658 1,483,240 2,473,898 985,456 1,354,780 2,340,236 Operating Income 2,217,329 576,888 1,179,550 -304,163 Interest Expenses: Interest on Loans Interest on Mortgage Bonds Total Interest Expenses 127,653 25,432 153,085 128,769 27,654 156,423 126,541 26,547 153,088 128,903 25,431 154,334 Earnings Before Taxes 2,064,244 420,465 1,026,462 -458,497 Federal & State Taxes @ 40% 3,344 3,344 3,344 3,344 NET INCOME 2,060,900 417,121 1,023,118 -461,841 Balance Sheet Year ending Year ending 12/31/15 12/31/14 ($ in thousands of dollars) Year ending 12/31/13 Year ending 12/31/12 Assets Current Assets Cash Marketable Securities Accounts Receivable Inventories Total Current Assets $ 8,723,453 1,225,000 54,679 231,445 10,234,577 $ 6,732,980 1,800,000 46,786 156,324 8,736,090 $ 4,321,098 1,800,000 12,324 236,743 6,370,165 $ 2,090,897 1,800,000 23,453 154,389 4,068,739 Long-Term Assets Property & Equipment at cost Less Accumulated Depreciation Net Property & Equipment Total Long-Term Assets 4,310,000 870,000 3,440,000 3,440,000 4,310,000 980,000 3,330,000 3,330,000 4,310,000 1,140,000 3,170,000 3,170,000 4,310,000 1,140,000 3,170,000 3,170,000 TOTAL ASSETS $ 13,674,577 $ 12,066,090 $ 9,540,165 $ 7,238,739 $ $ Liabilities Current Liabilities Accounts able Notes Payable @ 10% Taxes Payable Other Current Liabilities Current Portion of Longterm Debt Total Current Liabilities 2,500,000 3,200,000 1,250,000 650.000 13,003,982 8,321 2,500,000 3,200,000 1,250,000 650,000 12,508,321 $ 2,891,743 2,500,000 3,200,000 1,250,000 800,000 10,641,743 2,500,000 3,200,000 1,250,000 800,000 10,118,901 Long-Term Liabilities Mortgage Bonds @ 9.58% Total Long-Term Liabilities 1,150,000 1,150,000 950,000 950,000 950,000 950,000 950,000 950,000 TOTAL LIABILITIES $ 14,153,982 $ 13,458,321 $ 11,591,743 $ 11,068,901 Equity $ Common Stock Paid in Capital in excess of par value Retained Earnings $ 1,500,000 1,000,000 983,214 $ 1,500,000 1,000,000 898,732 1,500,000 1,000,000 850,935 $ 1,500,000 1,000,000 978,310 TOTAL EQUITY $ 3,483,214 $ 3,398,732 $ 3,350,935 $ 3,478,310 Income Statement Year ending 12/31/15 ($ in thousands of dollars) Year ending 12/31/14 Year ending 12/31/13 Year ending 12/31/12 Revenues Gross Sales Revenues Allowance for Sales Returned Net Sales Revenues $ 12,803,286 753,210 12,050,076 $ 10,990,658 856,098 10,134,560 $ 10,984,247 909,231 10,075,016 $ 9,083,450 965,032 8,118,418 TOTAL SALES 12,050,076 10,134,560 10,075,016 8,118,418 Expenses Cost of Goods Sold 7,180,765 6,891,237 6,421,568 6,082,345 Gross Profits 4,869,311 3,243,323 3,653,448 2,036,073 Operating Expenses: Selling & Marketing General Administrative Total Operating Expenses 997,672 1,654,310 2,651,982 1,123,245 1,543,190 2,666,435 990,658 1,483,240 2,473,898 985,456 1,354,780 2,340,236 Operating Income 2,217,329 576,888 1,179,550 -304,163 Interest Expenses: Interest on Loans Interest on Mortgage Bonds Total Interest Expenses 127,653 25,432 153,085 128,769 27,654 156,423 126,541 26,547 153,088 128,903 25,431 154,334 Earnings Before Taxes 2,064,244 420,465 1,026,462 -458,497 Federal & State Taxes @ 40% 3,344 3,344 3,344 3,344 NET INCOME 2,060,900 417,121 1,023,118 -461,841


