

Answered step by step
Verified Expert Solution
Question
1 Approved Answer
IDENTIFY THE INDUSTRY EXERCISE Exhibit 1 presents common-size balance sheets (presented in relative terms based on percentage of total assets) and select financial ratios for
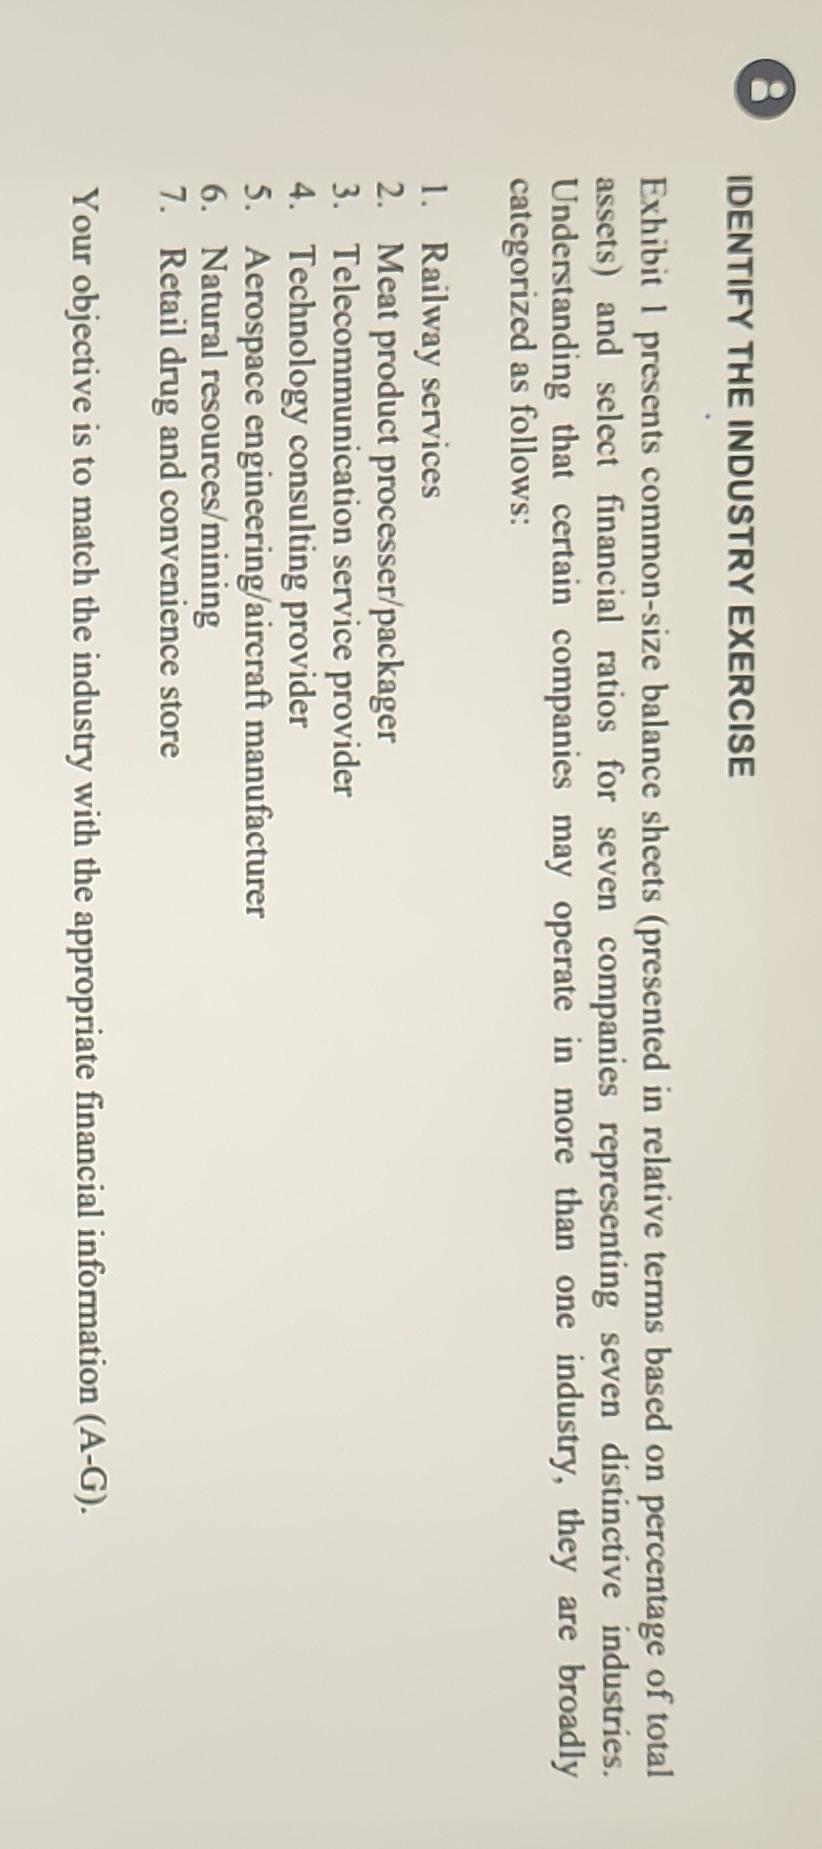
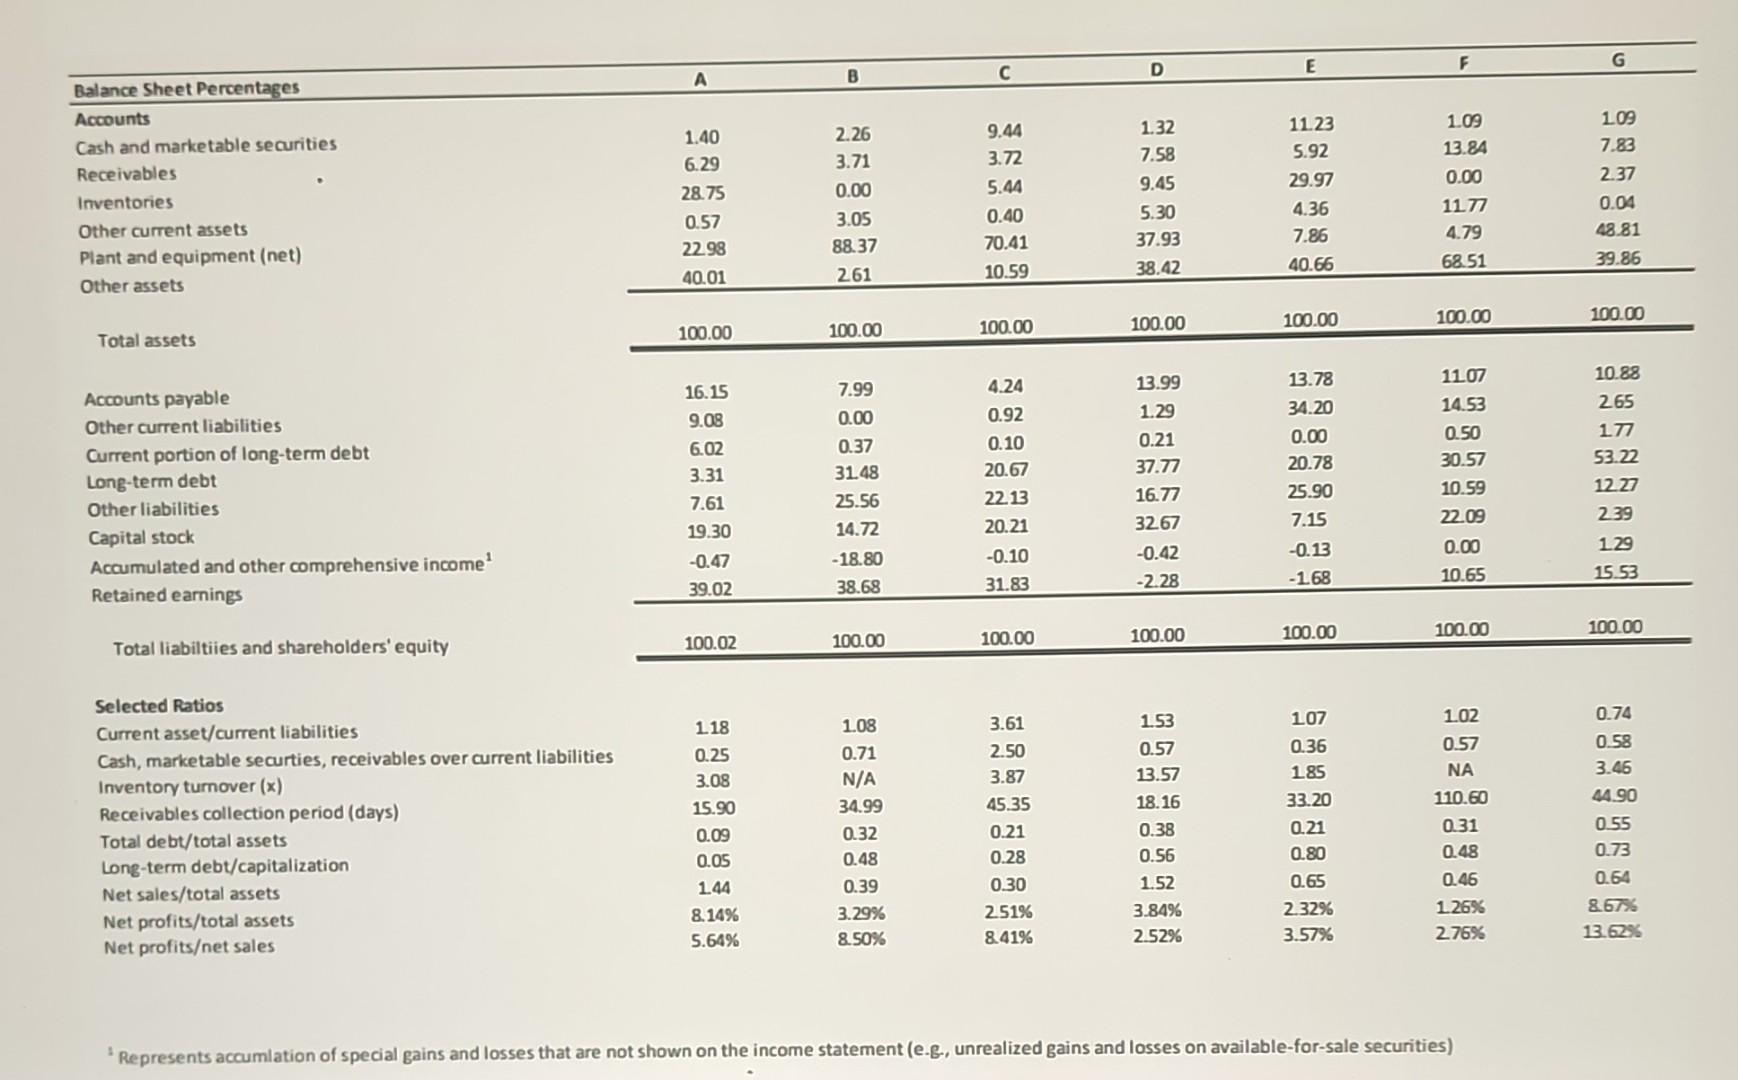
IDENTIFY THE INDUSTRY EXERCISE Exhibit 1 presents common-size balance sheets (presented in relative terms based on percentage of total assets) and select financial ratios for seven companies representing seven distinctive industries. Understanding that certain companies may operate in more than one industry, they are broadly categorized as follows: 1. Railway services 2. Meat product processer/packager 3. Telecommunication service provider 4. Technology consulting provider 5. Aerospace engineering/aircraft manufacturer 6. Natural resources/mining 7. Retail drug and convenience store Your objective is to match the industry with the appropriate financial information (A-G). \begin{tabular}{|c|c|c|c|c|c|c|c|} \hline Balance Sheet Percentages & A & B & C & D & E & F & G \\ \hline \multicolumn{8}{|l|}{\begin{tabular}{l} Balance Sheet Percentages \\ Accounts \end{tabular}} \\ \hline Cash and marketable securities & 1.40 & 2.26 & 9.44 & 1.32 & 11.23 & 1.09 & 109 \\ \hline Receivables & 6.29 & 3.71 & 3.72 & 7.58 & 5.92 & 13.84 & 7.83 \\ \hline Inventories & 28.75 & 0.00 & 5.44 & 9.45 & 29.97 & 0.00 & 2.37 \\ \hline Other current assets & 0.57 & 3.05 & 0.40 & 5.30 & 4.36 & 1177 & 0.04 \\ \hline Plant and equipment (net) & 2298 & 88.37 & 70.41 & 37.93 & 7.86 & 4.79 & 48.81 \\ \hline Other assets & 40.01 & 261 & 10.59 & 38.42 & 40.66 & 68.51 & 39.86 \\ \hline Total assets & 100.00 & 100.00 & 100.00 & 100.00 & 100.00 & 100.00 & 100.00 \\ \hline Accounts payable & 16.15 & 7.99 & 4.24 & 13.99 & 13.78 & 1107 & 10.88 \\ \hline Other current liabilities & 9.08 & 0.00 & 0.92 & 1.29 & 34.20 & 14.53 & 265 \\ \hline Current portion of long-term debt & 6.02 & 0.37 & 0.10 & 0.21 & 0.00 & 0.50 & 177 \\ \hline Long-term debt & 3.31 & 31.48 & 20.67 & 37.77 & 20.78 & 30.57 & 53.22 \\ \hline Other liabilities & 7.61 & 25.56 & 2213 & 16.77 & 25.90 & 10.59 & 1227 \\ \hline Capital stock & 19.30 & 14.72 & 20.21 & 3267 & 7.15 & 2209 & 239 \\ \hline Accumulated and other comprehensive income 1 & -0.47 & -18.80 & -0.10 & -0.42 & -0.13 & 0.00 & 129 \\ \hline Retained earnings & 39.02 & 38.68 & 31.83 & -2.28 & -168 & 10.65 & 15.53 \\ \hline Total liabiltiies and shareholders' equity & 100.02 & 100.00 & 100.00 & 100.00 & 100.00 & 100.00 & 100.00 \\ \hline \\ \hline Current asset/current liabilities & 118 & 1.08 & 3.61 & 1.53 & 107 & 102 & 0.74 \\ \hline Cash, marketable securties, receivables over current liabilities & 0.25 & 0.71 & 2.50 & 0.57 & 0.36 & 0.57 & 0.58 \\ \hline Inventory turnover (x) & 3.08 & N/A & 3.87 & 13.57 & 185 & NA & 3.46 \\ \hline Receivables collection period (days) & 15.90 & 34.99 & 45.35 & 18.16 & 33.20 & 110.60 & 44.90 \\ \hline Total debt/total assets & 0.09 & 0.32 & 0.21 & 0.38 & 0.21 & 0.31 & 0.55 \\ \hline Long-term debt/capitalization & 0.05 & 0.48 & 0.28 & 0.56 & 0.80 & 0.48 & 0.73 \\ \hline Net sales/total assets & 144 & 0.39 & 0.30 & 1.52 & 0.65 & 0.46 & 0.64 \\ \hline Net profits/total assets & 8.14% & 3.29% & 251% & 3.84% & 2.32% & 1.26% & 8.6% \\ \hline Net profitset sales & 5.64% & 8.50% & 8.41% & 2.52% & 3.57% & 276% & 13.62% \\ \hline \end{tabular} 'Represents accumlation of special gains and losses that are not shown on the income statement (e.g., unrealized gains and losses on available-for-sale securities)
Step by Step Solution
There are 3 Steps involved in it
Step: 1

Get Instant Access to Expert-Tailored Solutions
See step-by-step solutions with expert insights and AI powered tools for academic success
Step: 2

Step: 3
Ace Your Homework with AI
Get the answers you need in no time with our AI-driven, step-by-step assistance
Get Started
Internal Audit Handbook Management With The SAP Audit Roadmap
Authors: Henning Kagermann, William Kinney, Karlheinz Küting, Claus-Peter Weber, Z. Keil, C. Boecker, J. Busch, O. Bussiek, M. H. Christ, P. Eckes, M. Falk, P. S. Greenberg, B. Reichert, M. Wolf
2008th Edition