Idexo Corporation is a privately held designer and manufacturer of licensed college apparel in Cincinnati, Ohio. In late 2019, after several years of lackluster performance, the firms owner and founder, Rebecca Ferris, returned from retirement to replace the current CEO, reinvigorate the firm, and plan for its eventual sale or possible IPO. She has hired you to assist with developing the firms financial plan for the next five years.
Revenue growth has slowed dramatically in recent years and the firms net profit margin has actually been declining. Ferris is convinced the firm can do better. After only several weeks at the helm, she has already identified a number of potential improvements to drive the firms future growth.
Operational Improvements
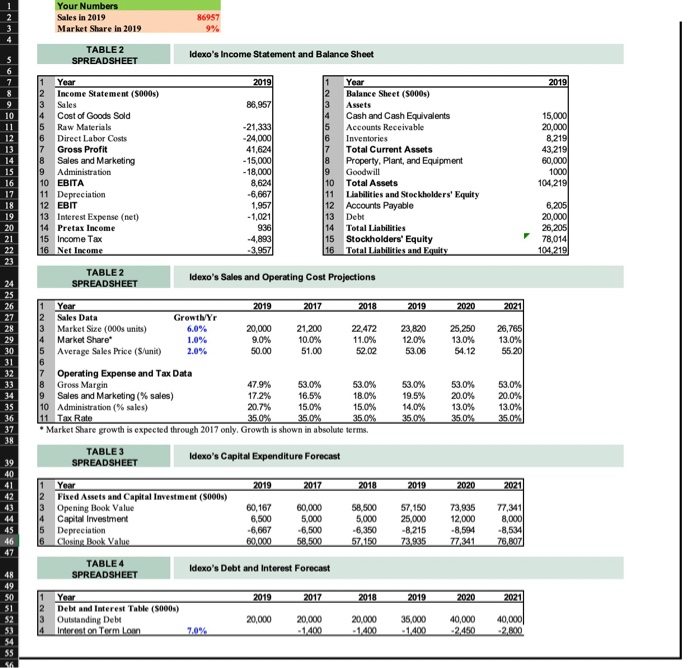
On the operational side, Ferris is quite optimistic regarding the companys prospects. The market is expected to grow by 6% per year, and Idexo produces a superior product. Idexos market share has not grown in recent years because prior management devoted insufficient resources to product development, sales, and marketing. At the same time, Idexo has overspent on administrative costs. Indeed, from Table 1, Idexos current administrative expenses are 18% of sales, which exceeds its expenditures on sales and marketing (15% of sales). Competitors spend less on administrative overhead than on sales and marketing.
Ferris plans to cut administrative costs immediately to 15% of sales and redirect resources to new product development, sales, and marketing. By doing so, she believes Idexo can increase its market share from 10% to 14% over the next four years. Using the existing production lines, the increased sales demand can be met in the short run by increasing overtime and running some weekend shifts. The resulting increase in labor costs, however, is likely to lead to a decline in the firms gross margin to 53%. Table 2 shows sales and operating-cost projections for the next five years based on this plan, including the reallocation of resources from administration to sales and marketing over the five-year period, and an increase in Idexos average selling price at a 2% inflation rate each year.
Expansion Plans
Table 3 shows the forecast for Idexos capital expenditures over the next five years. Based on the estimates for capital expenditures and depreciation, this spreadsheet tracks the book value of Idexos plant, property, and equipment starting from its level at the end of 2019. Note that investment is expected to remain relatively low over the next two yearsslightly below depreciation. Idexo will expand production during this period by using its existing plant more efficiently.
However, once Idexos volume grows by more than 50% over its current level, the firm will need to undertake a major expansion to increase its manufacturing capacity.
Working Capital Management
To compensate for its weak sales and marketing efforts, Idexo has sought to maintain the loyalty of its retailers, in part through a very lax credit policy. This policy affects Idexos working capital requirements: For every extra day that customers take to pay, another days sales revenue is added to accounts receivable (rather than received in cash).
The standard for the industry is 45 days. Ferris believes that Idexo can tighten its credit policy to achieve this goal without sacrificing sales.
Ferris does not foresee any other significant improvements in Idexos working capital management, and expects inventories and accounts payable to increase proportionately with sales growth. The firm will also need to maintain a minimum cash balance equal to 30 days sales revenue to meet its liquidity needs. It earns no interest on this minimal balance, and Ferris plans to pay out all excess cash each year to the firms shareholders as dividends.
Capital Structure Changes: Levering Up
Idexo currently has $20 million in debt outstanding with an interest rate of 7%, and it will pay interest only on this debt during the next five years. The firm will also obtain additional financing at the end of years 2019 and 2020 associated with the expansion of its manufacturing plant, as shown in Table 4. While Idexos credit quality will likely improve by that time, interest rates may also increase somewhat. You expect that rates on these future loans will be about 7% as well.
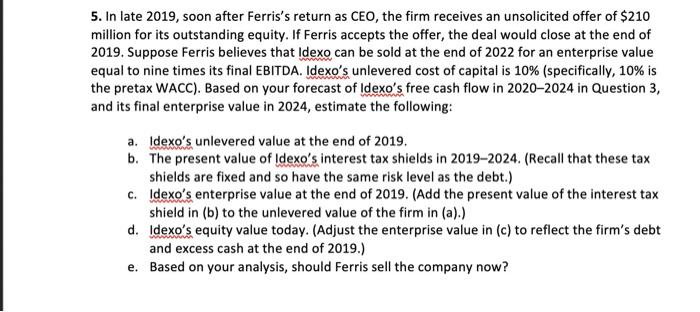
Your Numbers Sales in 2019 Market Share in 2019 86957 TABLE 2 SPREADSHEET Idexo's Income Statement and Balance Sheet 2019 2019 86,957 10 Year Income Statement (5000s) Sales Cost of Goods Sold Raw Materials Direct Labor Costs Gross Profit Sales and Marketing Administration EBITA Depreciation EBIT 13 Interest Expense (net) Pretax Income 15 Income Tax 16 Net Income -21,333 -24,000 41,624 - 15,000 - 18,000 8,624 -6,667 1.957 - 1,021 Balance Sheet (S000s) Assets Cash and Cash Equivalents Accounts Receivable Inventories Total Current Assets Property. Plant, and Equipment Goodwill Total Assets Liabilities and Stockholders' Equity Accounts Payable Debt Total Liabilities Stockholders' Equity Total Liabilities and Equity 15,000 20.000 8.219 43.2191 60,000 1000 104.219 9 10 12 13 14 6.205 20,000 26,205 78,014 104219) -4,893 3957 16 TABLE 2 SPREADSHEET Idexo's Sales and Operating Cost Projections 2019 2017 2018 2019 2020 2021 Year Sales Data Market Size (000s units) Market Share Average Sales Price (S/unit) GrowthYr 6.0% 29 10% 20% 20,000 9.0% 50.00 OX 21,200 10.0% 51.00 22.472 11.0% 52.02 23,820 12.0% 53.06 25,250 13.0% 54.12 26,7651 13.0% 55.20 2.0% 30 31 32 53.0% 19.5% Operating Expense and Tax Data Gross Margin 47.9% 53.0% 53.0% Sales and Marketing (% sales) 17.2% 16.5% 18.0% 10 Administration (% sales) 20.7% 15.0% 15.0% 11 Tax Rate 35.0% 35.0% 35 0% Market Share growth is expected through 2017 only, Growth is shown in absolute terms. 53.0% 20.0% 13.0% 35.0% 53.0% 20.0% 13.0% 35 01 14.0% 35.0% 35 36 37 38 TABLE 3 SPREADSHEET Idexo's Capital Expenditure Forecast 39 41 2019 2017 2018 2019 2020 2021 11 2 42 43 Year Fixed Assets and Capital Investment (5000s) Opening Book Value Capital Investment Depreciation Closing Book Value 60, 167 6,500 -6,667 60,000 60,000 5,000 -6,500 58.500 SA 58,500 5.000 -6.350 57.150 57,150 25.000 -8 215 73.935 7 3,935 12.000 -8,594 77.341 77,341 8,000 -8,534 76.807| 5 16 46 TABLE4 SPREADSHEET Idexo's Debt and Interest Forecast 1 Year 2019 2017 2018 2019 2020 2021 SONS Debt and Interest Table (5000s) Outstanding Debt Interest on Term Loan 20,000 20,000 1400 20,000 1400 35,000 1.400 40,000 2.450 40,000 -2.800 4 5. In late 2019, soon after Ferris's return as CEO, the firm receives an unsolicited offer of $210 million for its outstanding equity. If Ferris accepts the offer, the deal would close at the end of 2019. Suppose Ferris believes that Idexo can be sold at the end of 2022 for an enterprise value equal to nine times its final EBITDA. Idexo's unlevered cost of capital is 10% (specifically, 10% is the pretax WACC). Based on your forecast of Idexo's free cash flow in 2020-2024 in Question 3, and its final enterprise value in 2024, estimate the following: a. Idexo's unlevered value at the end of 2019. b. The present value of Idexo's interest tax shields in 2019-2024. (Recall that these tax shields are fixed and so have the same risk level as the debt.) c. Idexo's enterprise value at the end of 2019. (Add the present value of the interest tax shield in (b) to the unlevered value of the firm in (a).) d. Idexo's equity value today. (Adjust the enterprise value in (c) to reflect the firm's debt and excess cash at the end of 2019.) e. Based on your analysis, should Ferris sell the company now? Your Numbers Sales in 2019 Market Share in 2019 86957 TABLE 2 SPREADSHEET Idexo's Income Statement and Balance Sheet 2019 2019 86,957 10 Year Income Statement (5000s) Sales Cost of Goods Sold Raw Materials Direct Labor Costs Gross Profit Sales and Marketing Administration EBITA Depreciation EBIT 13 Interest Expense (net) Pretax Income 15 Income Tax 16 Net Income -21,333 -24,000 41,624 - 15,000 - 18,000 8,624 -6,667 1.957 - 1,021 Balance Sheet (S000s) Assets Cash and Cash Equivalents Accounts Receivable Inventories Total Current Assets Property. Plant, and Equipment Goodwill Total Assets Liabilities and Stockholders' Equity Accounts Payable Debt Total Liabilities Stockholders' Equity Total Liabilities and Equity 15,000 20.000 8.219 43.2191 60,000 1000 104.219 9 10 12 13 14 6.205 20,000 26,205 78,014 104219) -4,893 3957 16 TABLE 2 SPREADSHEET Idexo's Sales and Operating Cost Projections 2019 2017 2018 2019 2020 2021 Year Sales Data Market Size (000s units) Market Share Average Sales Price (S/unit) GrowthYr 6.0% 29 10% 20% 20,000 9.0% 50.00 OX 21,200 10.0% 51.00 22.472 11.0% 52.02 23,820 12.0% 53.06 25,250 13.0% 54.12 26,7651 13.0% 55.20 2.0% 30 31 32 53.0% 19.5% Operating Expense and Tax Data Gross Margin 47.9% 53.0% 53.0% Sales and Marketing (% sales) 17.2% 16.5% 18.0% 10 Administration (% sales) 20.7% 15.0% 15.0% 11 Tax Rate 35.0% 35.0% 35 0% Market Share growth is expected through 2017 only, Growth is shown in absolute terms. 53.0% 20.0% 13.0% 35.0% 53.0% 20.0% 13.0% 35 01 14.0% 35.0% 35 36 37 38 TABLE 3 SPREADSHEET Idexo's Capital Expenditure Forecast 39 41 2019 2017 2018 2019 2020 2021 11 2 42 43 Year Fixed Assets and Capital Investment (5000s) Opening Book Value Capital Investment Depreciation Closing Book Value 60, 167 6,500 -6,667 60,000 60,000 5,000 -6,500 58.500 SA 58,500 5.000 -6.350 57.150 57,150 25.000 -8 215 73.935 7 3,935 12.000 -8,594 77.341 77,341 8,000 -8,534 76.807| 5 16 46 TABLE4 SPREADSHEET Idexo's Debt and Interest Forecast 1 Year 2019 2017 2018 2019 2020 2021 SONS Debt and Interest Table (5000s) Outstanding Debt Interest on Term Loan 20,000 20,000 1400 20,000 1400 35,000 1.400 40,000 2.450 40,000 -2.800 4 5. In late 2019, soon after Ferris's return as CEO, the firm receives an unsolicited offer of $210 million for its outstanding equity. If Ferris accepts the offer, the deal would close at the end of 2019. Suppose Ferris believes that Idexo can be sold at the end of 2022 for an enterprise value equal to nine times its final EBITDA. Idexo's unlevered cost of capital is 10% (specifically, 10% is the pretax WACC). Based on your forecast of Idexo's free cash flow in 2020-2024 in Question 3, and its final enterprise value in 2024, estimate the following: a. Idexo's unlevered value at the end of 2019. b. The present value of Idexo's interest tax shields in 2019-2024. (Recall that these tax shields are fixed and so have the same risk level as the debt.) c. Idexo's enterprise value at the end of 2019. (Add the present value of the interest tax shield in (b) to the unlevered value of the firm in (a).) d. Idexo's equity value today. (Adjust the enterprise value in (c) to reflect the firm's debt and excess cash at the end of 2019.) e. Based on your analysis, should Ferris sell the company now


