If anyone could answer this for me that would EXTREMELY appreciated! I give really fast thumbs up!
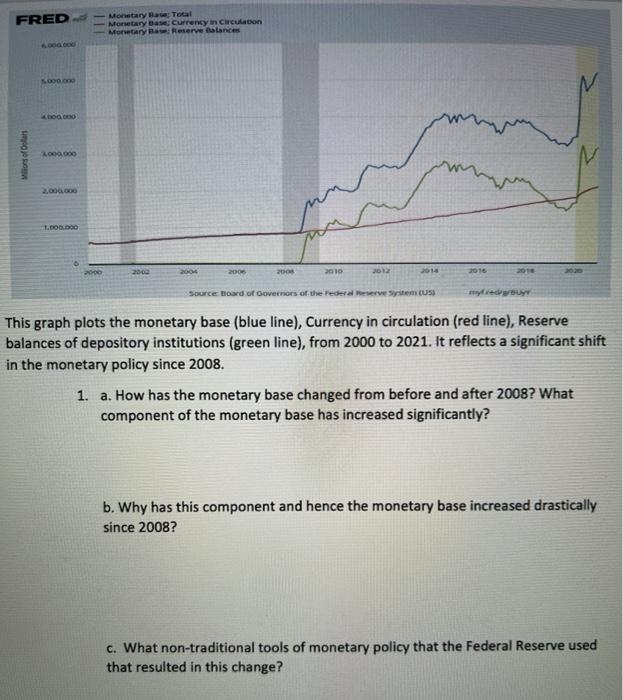
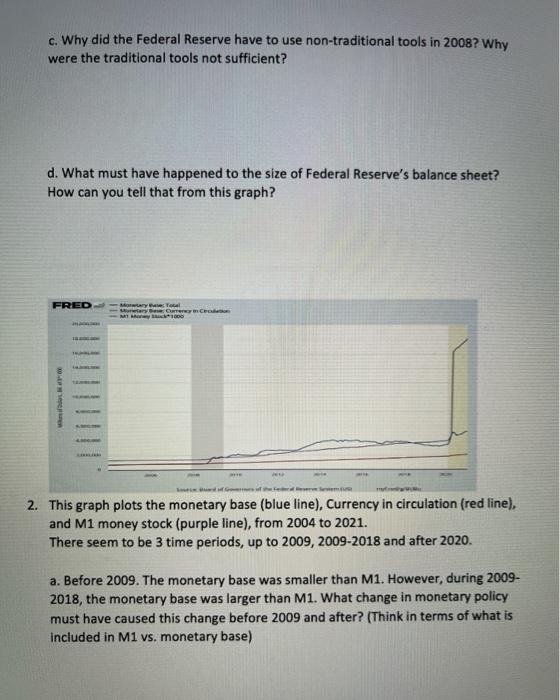
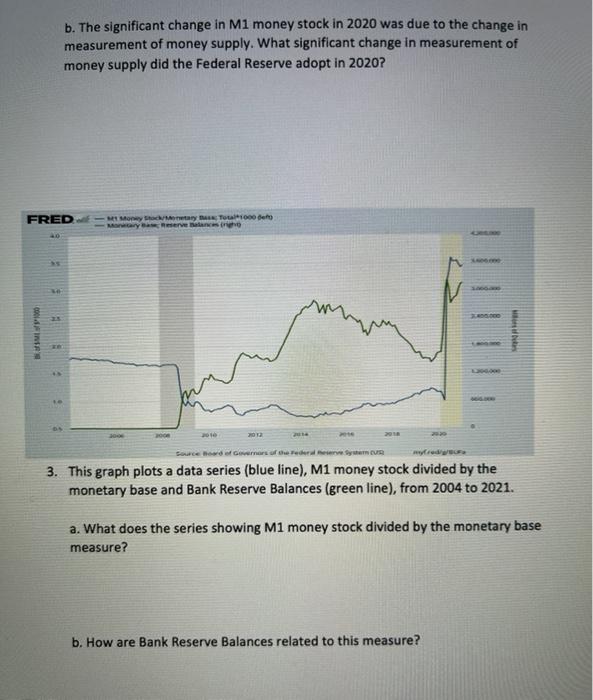
FRED Monetary B Total Monetary BaseCurrency in Circulation Morretary Reserve Balances M 400000 Wilosoflar 2.000.000 M 2,000,000 1.OOO.DOC 2004 2000 2008 2010 2013 2014 2018 Source Board of Governors of the Federal Reserve System (US) This graph plots the monetary base (blue line), Currency in circulation (red line), Reserve balances of depository institutions (green line), from 2000 to 2021. It reflects a significant shift in the monetary policy since 2008. 1. a. How has the monetary base changed from before and after 2008? What component of the monetary base has increased significantly? b. Why has this component and hence the monetary base increased drastically since 2008? c. What non-traditional tools of monetary policy that the Federal Reserve used that resulted in this change? c. Why did the Federal Reserve have to use non-traditional tools in 2008? Why were the traditional tools not sufficient? d. What must have happened to the size of Federal Reserve's balance sheet? How can you tell that from this graph? FRED Mool Mr.Com Peren 2. This graph plots the monetary base (blue line), Currency in circulation (red line), and M1 money stock (purple line), from 2004 to 2021. There seem to be 3 time periods, up to 2009, 2009-2018 and after 2020. a. Before 2009. The monetary base was smaller than M1. However, during 2009- 2018, the monetary base was larger than M1. What change in monetary policy must have caused this change before 2009 and after? (Think in terms of what is included in M1 vs. monetary base) b. The significant change in Mi money stock in 2020 was due to the change in measurement of money supply. What significant change in measurement of money supply did the Federal Reserve adopt in 2020? FRED Money Tota1000 Mary Reserve Banho 40 Cold In MINEN 8 010 012 Source of mors of the Fedem 3. This graph plots a data series (blue line), M1 money stock divided by the monetary base and Bank Reserve Balances (green line), from 2004 to 2021. a. What does the series showing M1 money stock divided by the monetary base measure? b. How are Bank Reserve Balances related to this measure? FRED Monetary B Total Monetary BaseCurrency in Circulation Morretary Reserve Balances M 400000 Wilosoflar 2.000.000 M 2,000,000 1.OOO.DOC 2004 2000 2008 2010 2013 2014 2018 Source Board of Governors of the Federal Reserve System (US) This graph plots the monetary base (blue line), Currency in circulation (red line), Reserve balances of depository institutions (green line), from 2000 to 2021. It reflects a significant shift in the monetary policy since 2008. 1. a. How has the monetary base changed from before and after 2008? What component of the monetary base has increased significantly? b. Why has this component and hence the monetary base increased drastically since 2008? c. What non-traditional tools of monetary policy that the Federal Reserve used that resulted in this change? c. Why did the Federal Reserve have to use non-traditional tools in 2008? Why were the traditional tools not sufficient? d. What must have happened to the size of Federal Reserve's balance sheet? How can you tell that from this graph? FRED Mool Mr.Com Peren 2. This graph plots the monetary base (blue line), Currency in circulation (red line), and M1 money stock (purple line), from 2004 to 2021. There seem to be 3 time periods, up to 2009, 2009-2018 and after 2020. a. Before 2009. The monetary base was smaller than M1. However, during 2009- 2018, the monetary base was larger than M1. What change in monetary policy must have caused this change before 2009 and after? (Think in terms of what is included in M1 vs. monetary base) b. The significant change in Mi money stock in 2020 was due to the change in measurement of money supply. What significant change in measurement of money supply did the Federal Reserve adopt in 2020? FRED Money Tota1000 Mary Reserve Banho 40 Cold In MINEN 8 010 012 Source of mors of the Fedem 3. This graph plots a data series (blue line), M1 money stock divided by the monetary base and Bank Reserve Balances (green line), from 2004 to 2021. a. What does the series showing M1 money stock divided by the monetary base measure? b. How are Bank Reserve Balances related to this measure