

Question
If I want to label, and change the color and size of one specific point on my graph (the uppermost point on the not metro
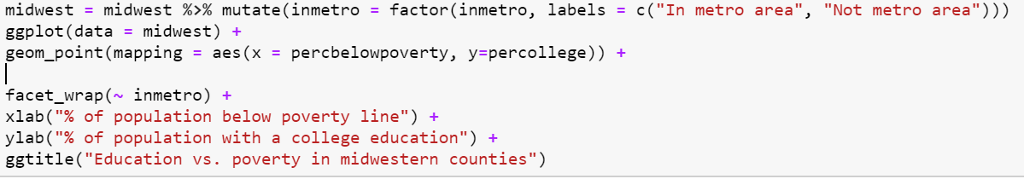
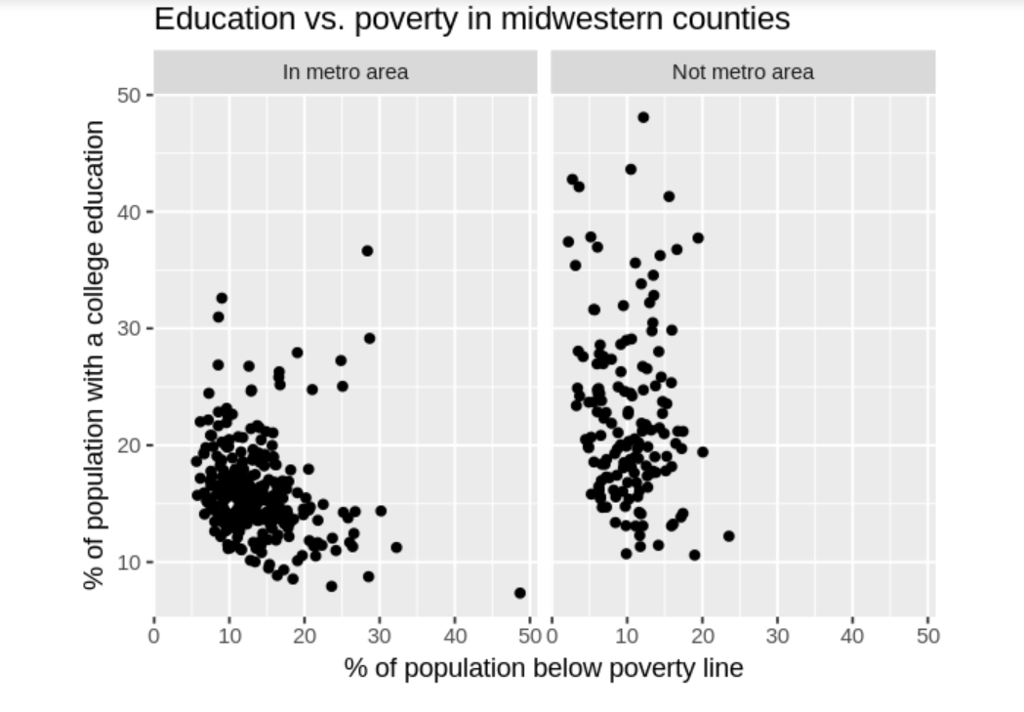 If I want to label, and change the color and size of one specific point on my graph (the uppermost point on the not metro graph, if it matters), how do I go about doing that? I can only change the color and size and stuff of all the points, not just the one.
Step by Step Solution
There are 3 Steps involved in it
Step: 1

Get Instant Access to Expert-Tailored Solutions
See step-by-step solutions with expert insights and AI powered tools for academic success
Step: 2

Step: 3
Ace Your Homework with AI
Get the answers you need in no time with our AI-driven, step-by-step assistance
Get Started
Database And Expert Systems Applications 24th International Conference Dexa 2013 Prague Czech Republic August 2013 Proceedings Part 2 Lncs 8056
Authors: Hendrik Decker ,Lenka Lhotska ,Sebastian Link ,Josef Basl ,A Min Tjoa
2013th Edition
3642401724, 978-3642401725