4. A manufacturer wants to set up a control chart for the number (i.e. c-chart) of defective chips or its corresponding proportions (i.e. p

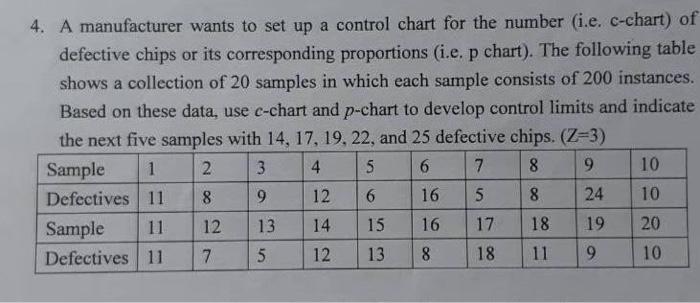
4. A manufacturer wants to set up a control chart for the number (i.e. c-chart) of defective chips or its corresponding proportions (i.e. p chart). The following table shows a collection of 20 samples in which each sample consists of 200 instances. Based on these data, use c-chart and p-chart to develop control limits and indicate the next five samples with 14, 17, 19, 22, and 25 defective chips. (Z=3) Sample 1 2 3 4 5 6 7 8 9 Defectives 11 8 9 12 6 16 5 8 24 Sample 11 12 14 15 16 17 Defectives 11 7 12 13 8 18 13 5 18 11 19 9 10 10 20 10
Step by Step Solution
3.43 Rating (162 Votes )
There are 3 Steps involved in it
Step: 1
Using c chart Mean c value cbar sum of all defect values Number of samples 213 20 1065 c...
See step-by-step solutions with expert insights and AI powered tools for academic success
Step: 2

Step: 3

Ace Your Homework with AI
Get the answers you need in no time with our AI-driven, step-by-step assistance
Get Started


