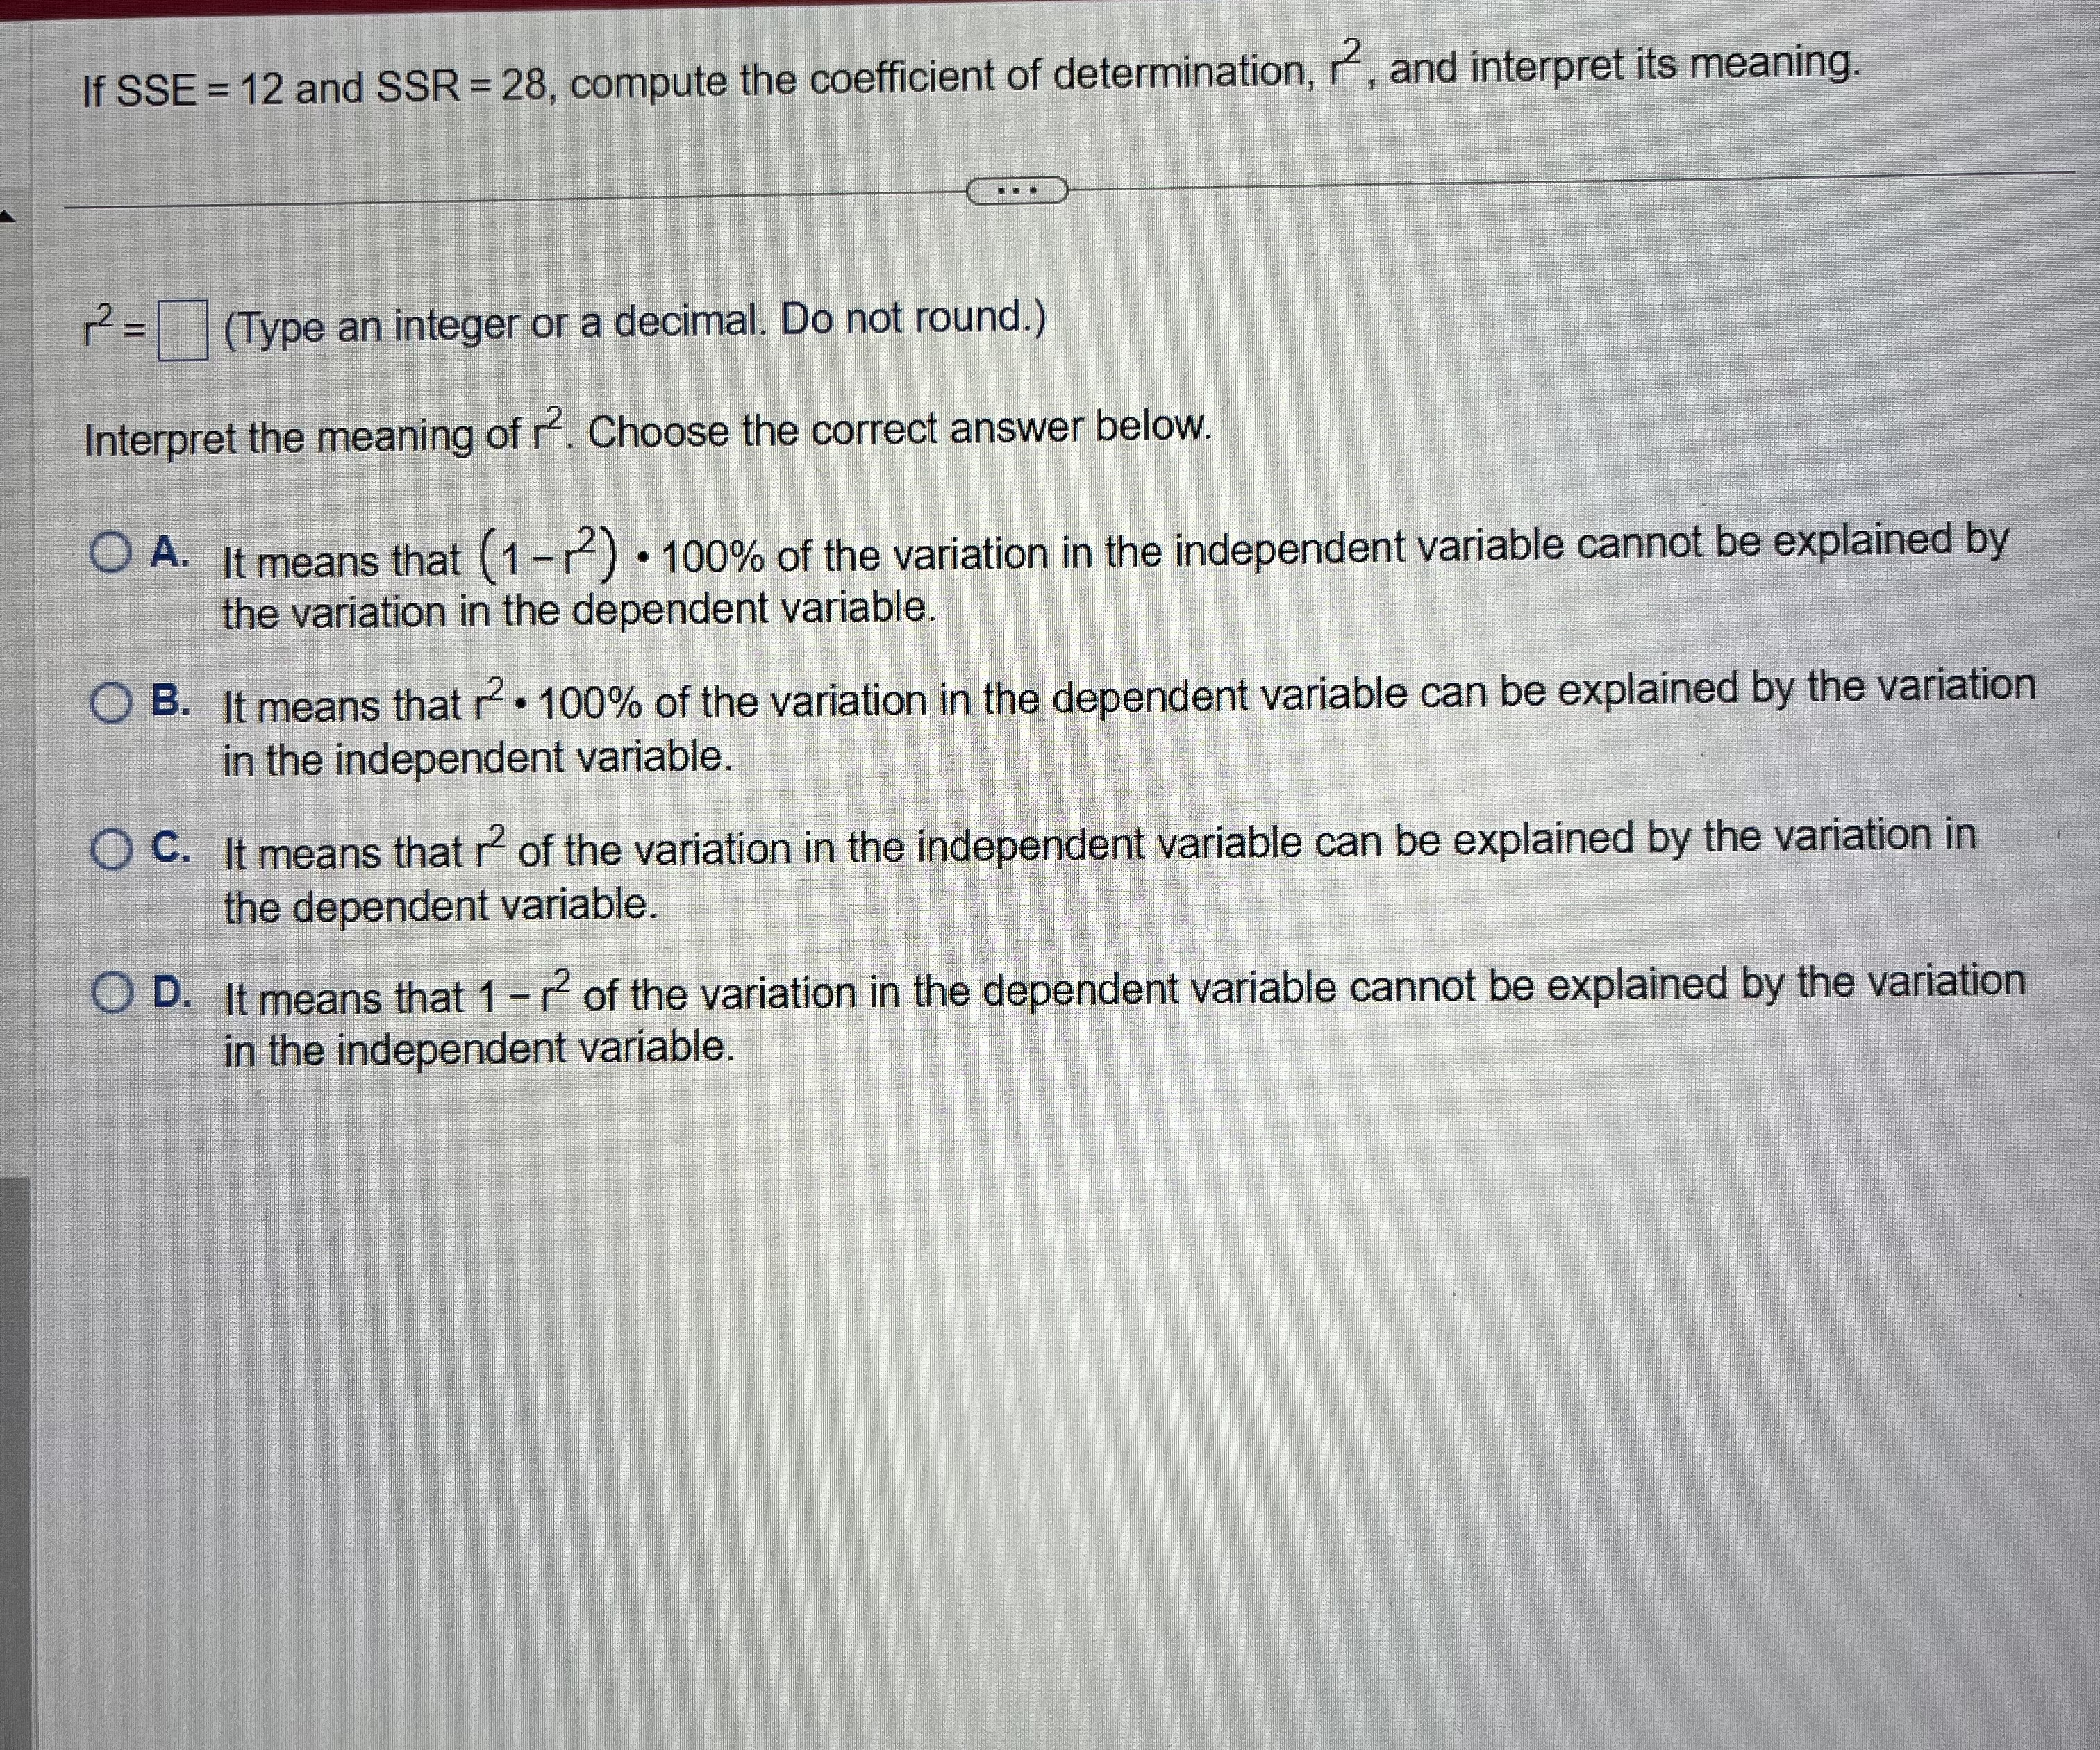
If SSE = 12 and SSR = 28, compute the coefficient of determination, , and interpret its meaning. 12 =(Type an integer or a decimal.
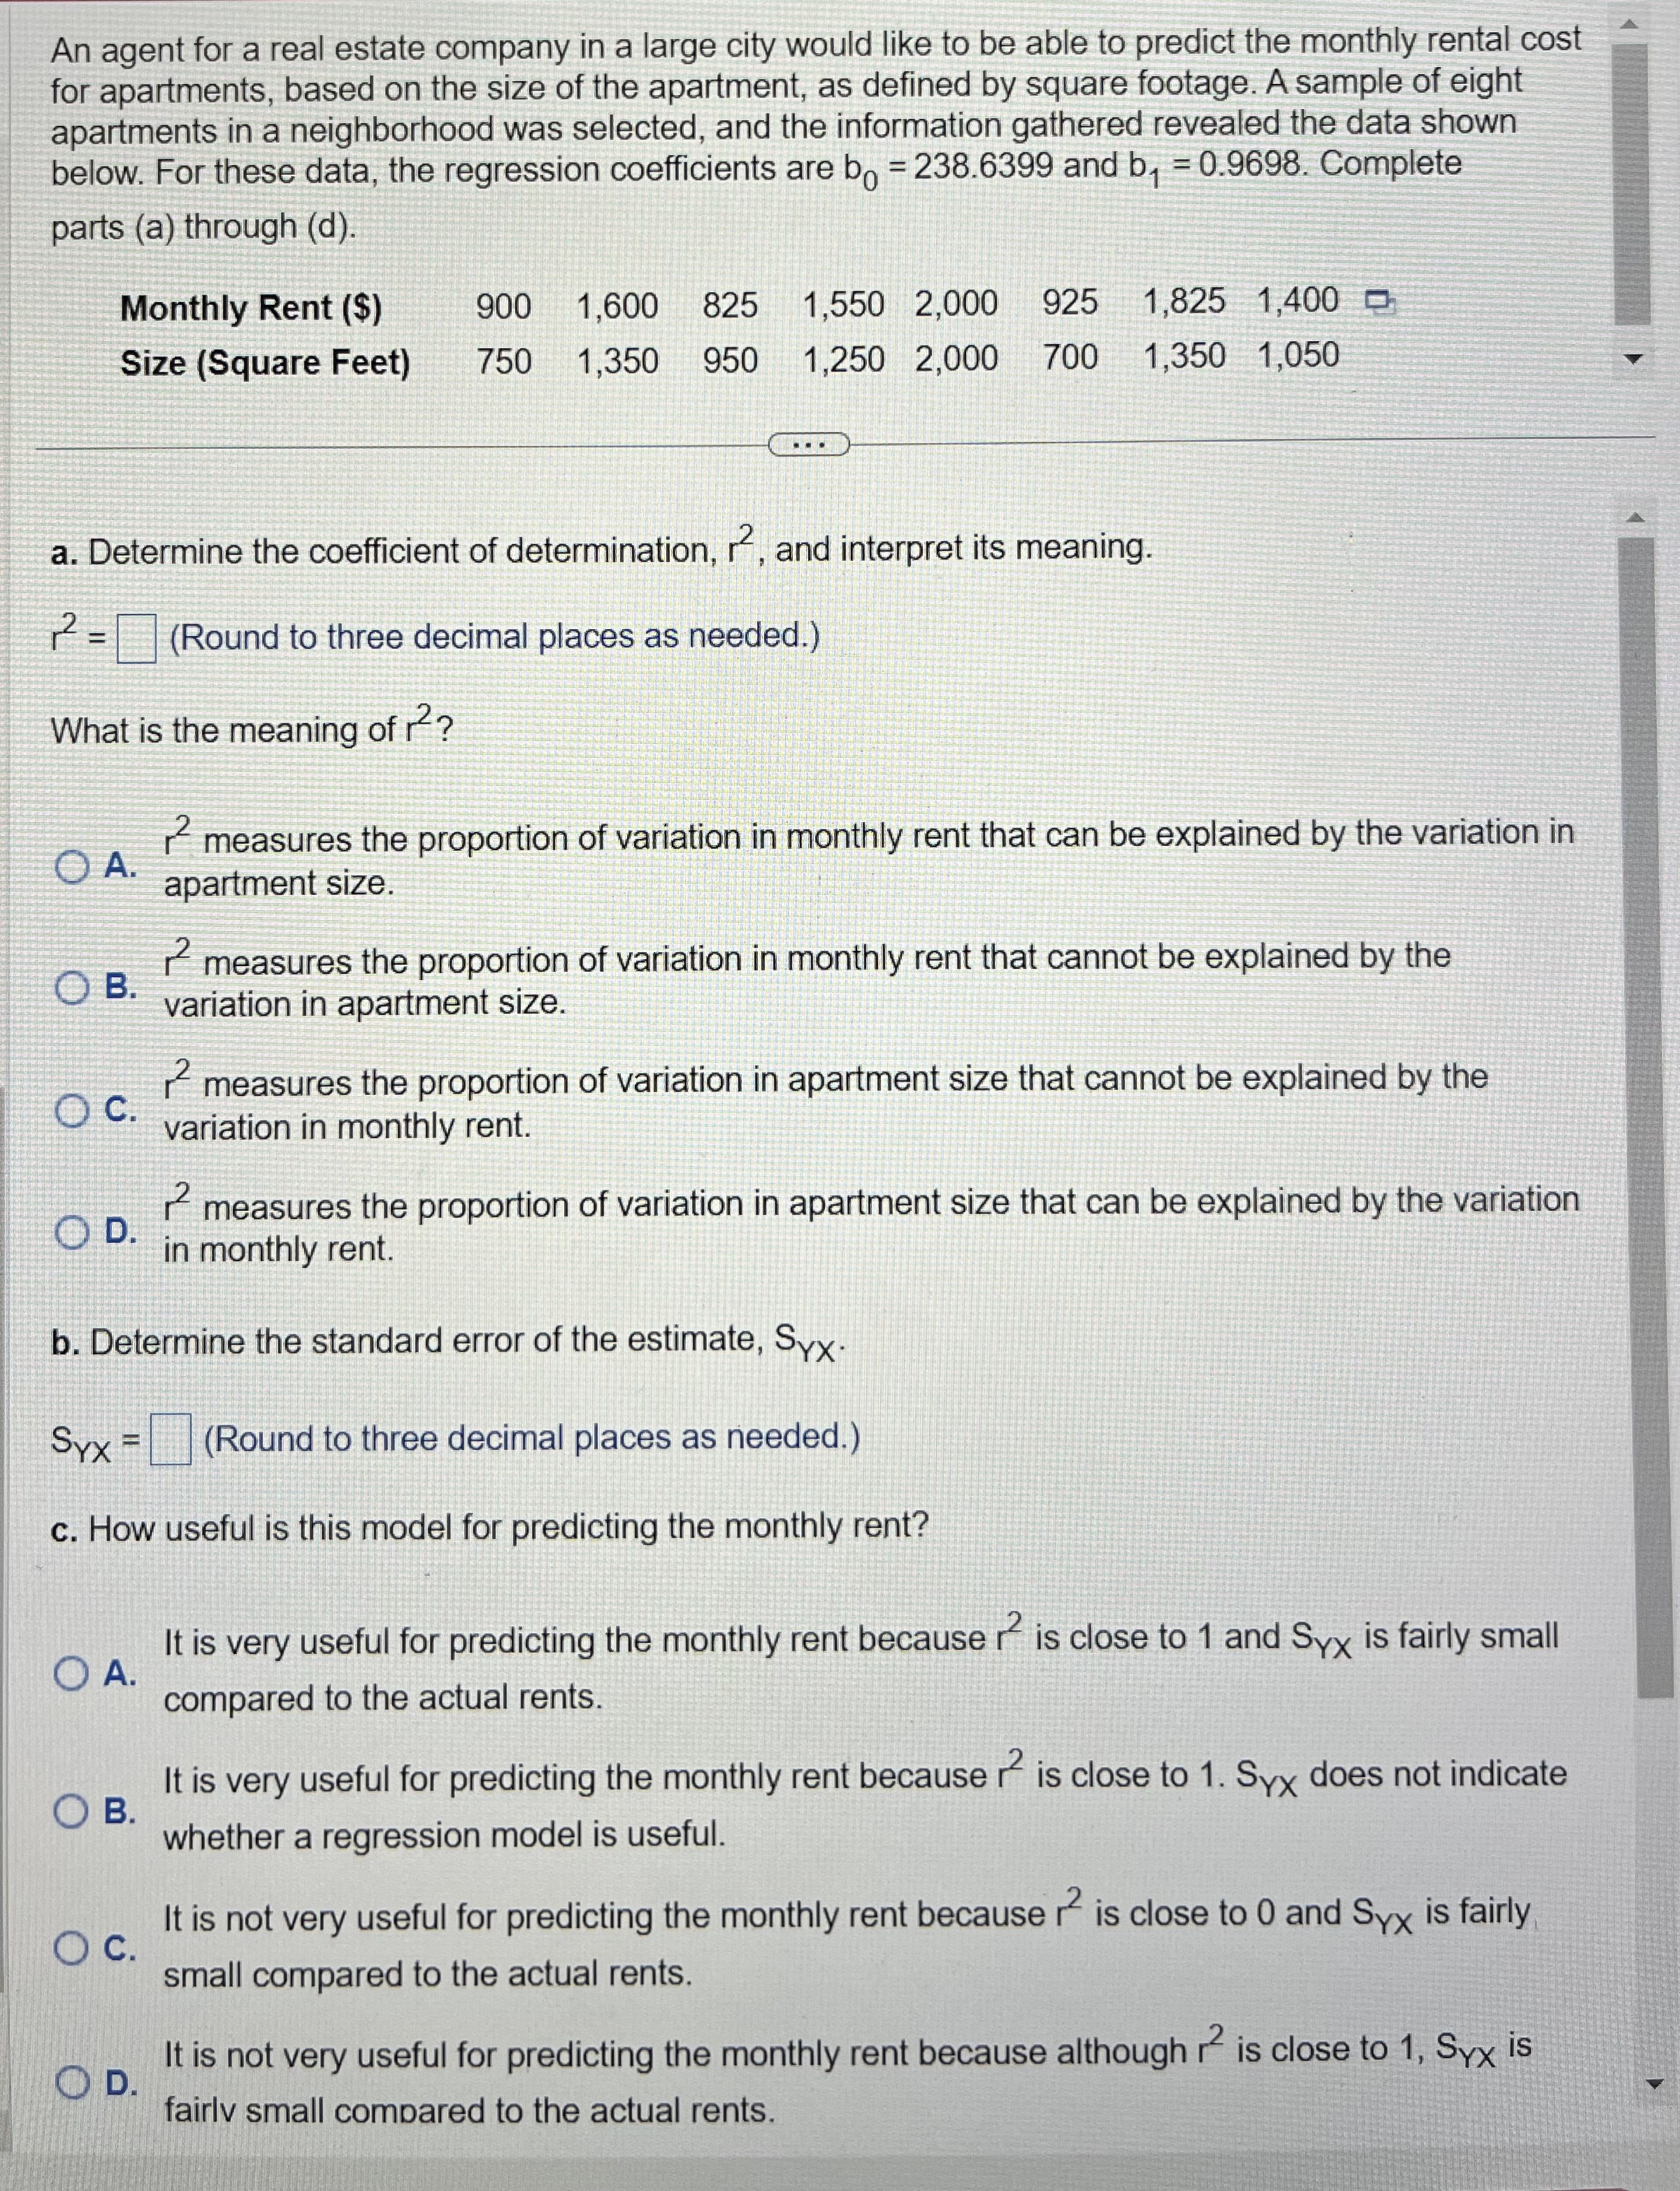
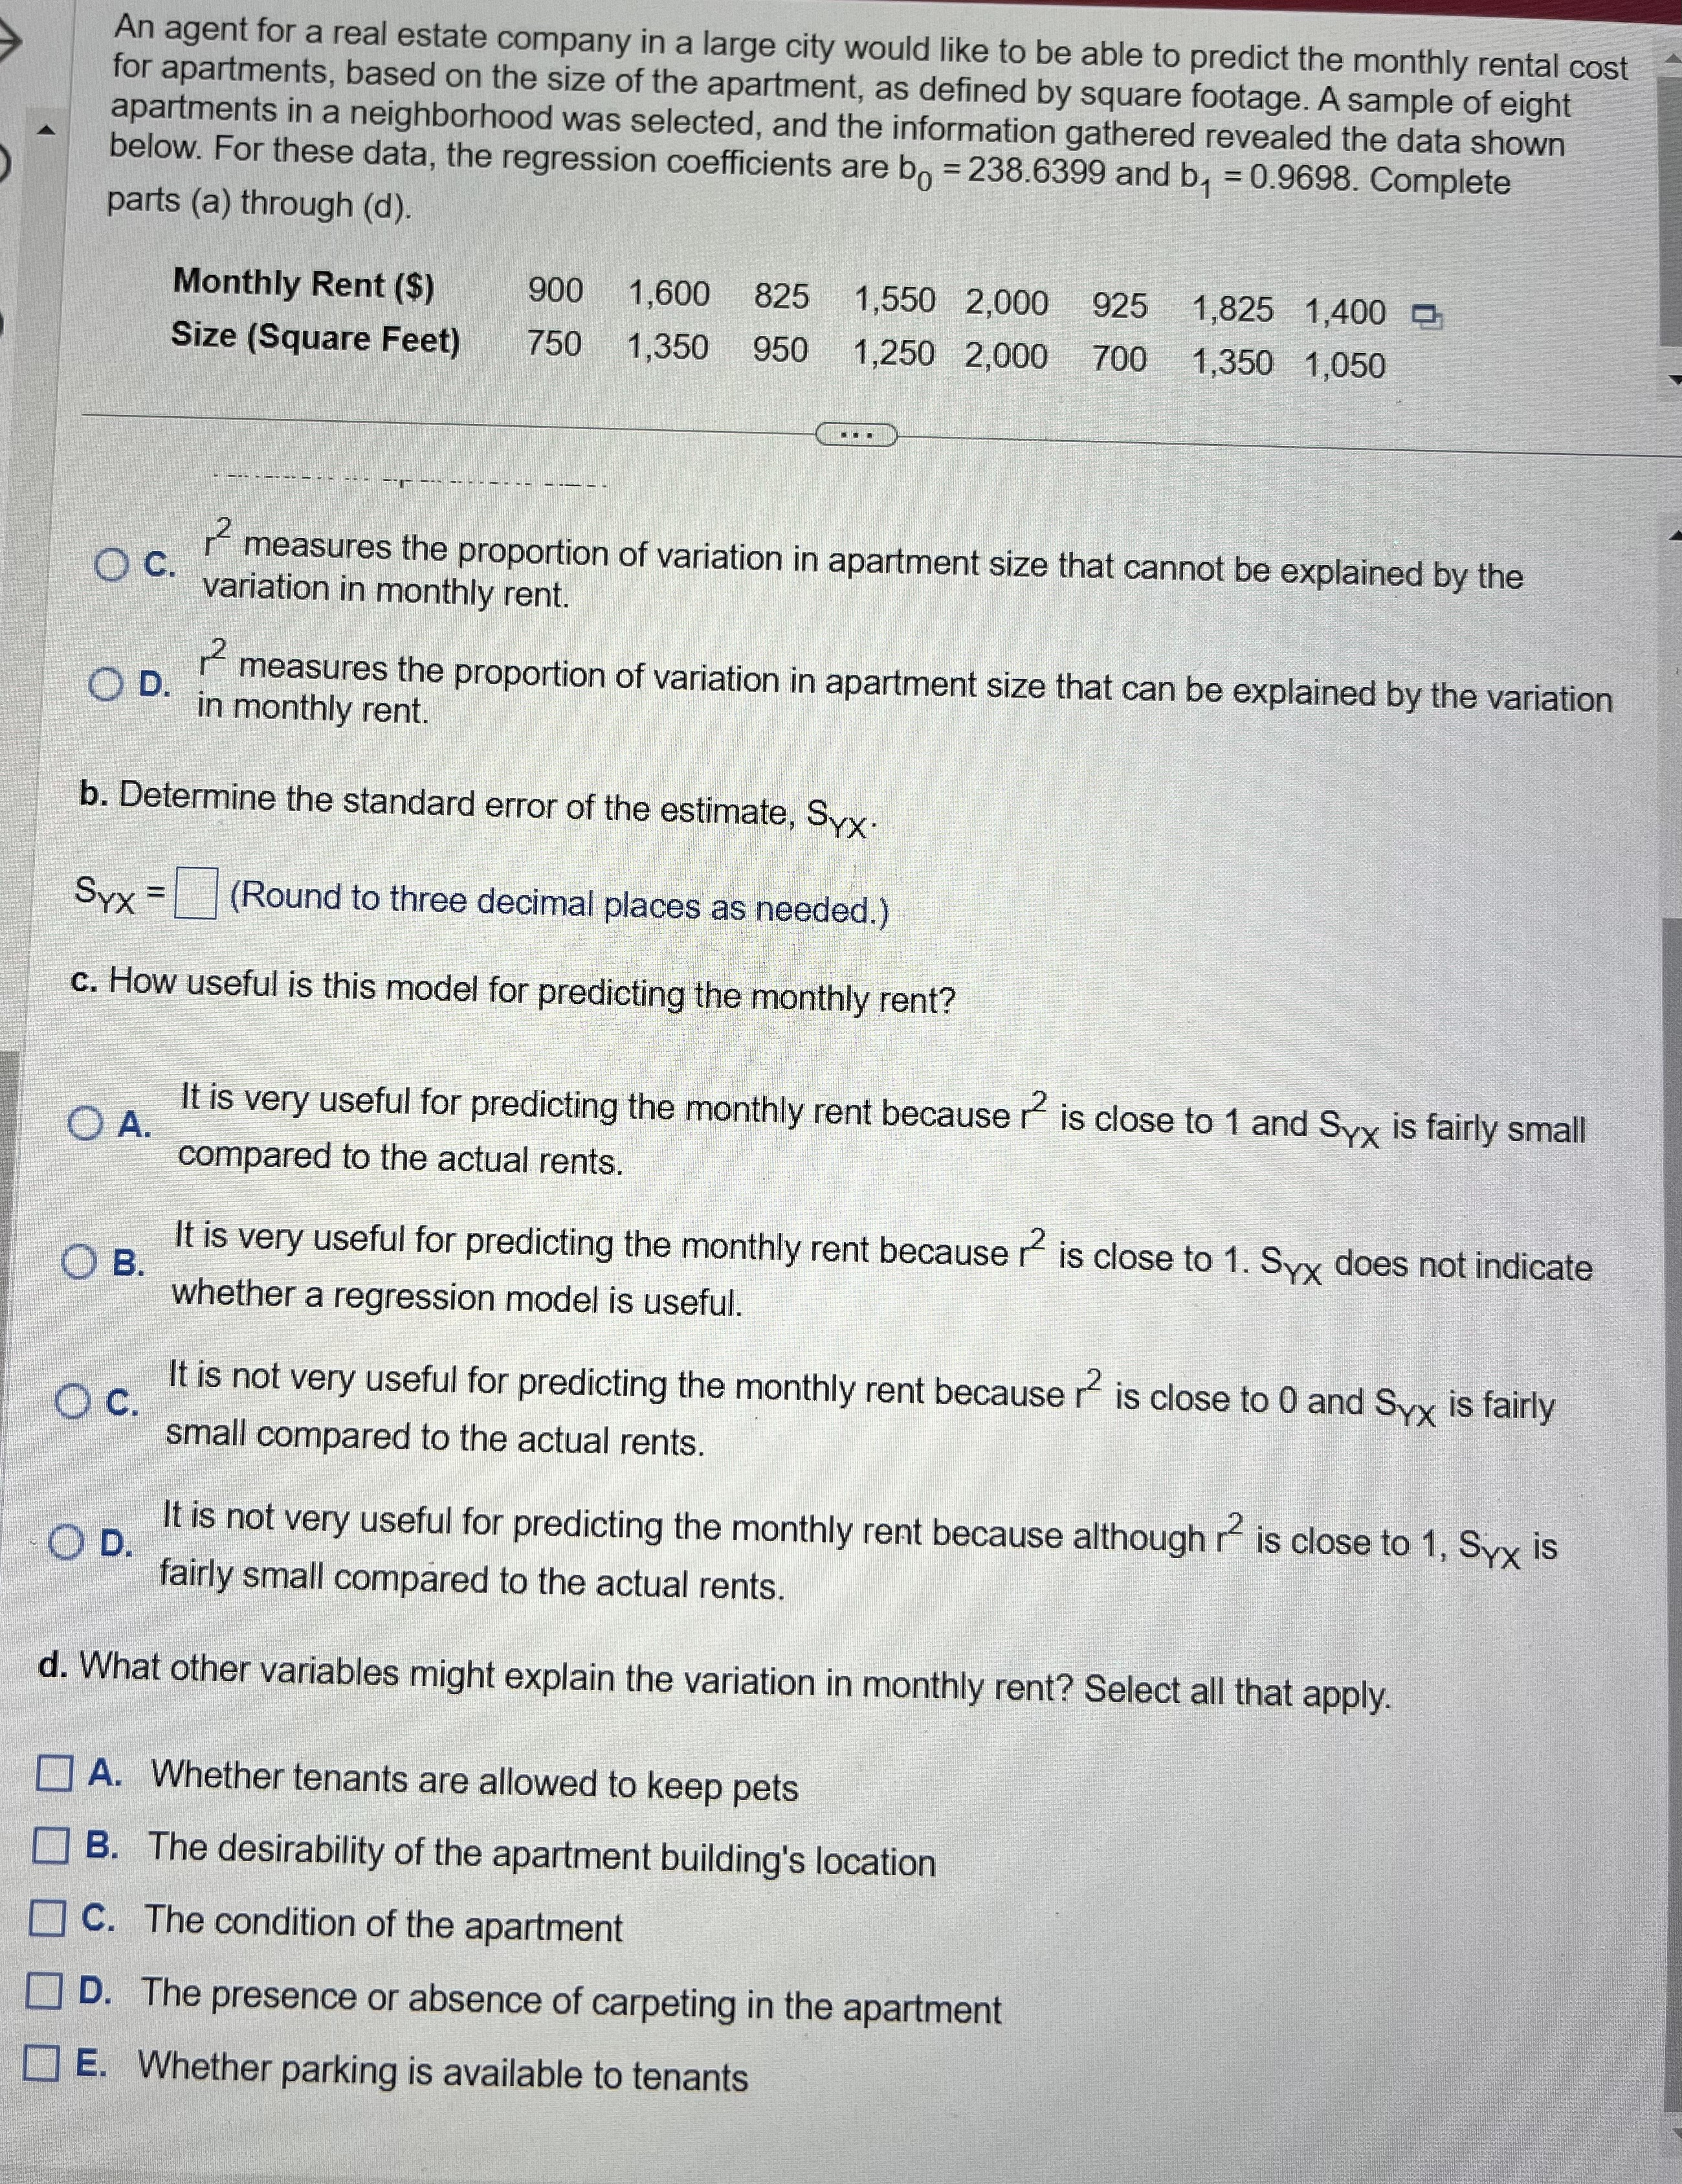
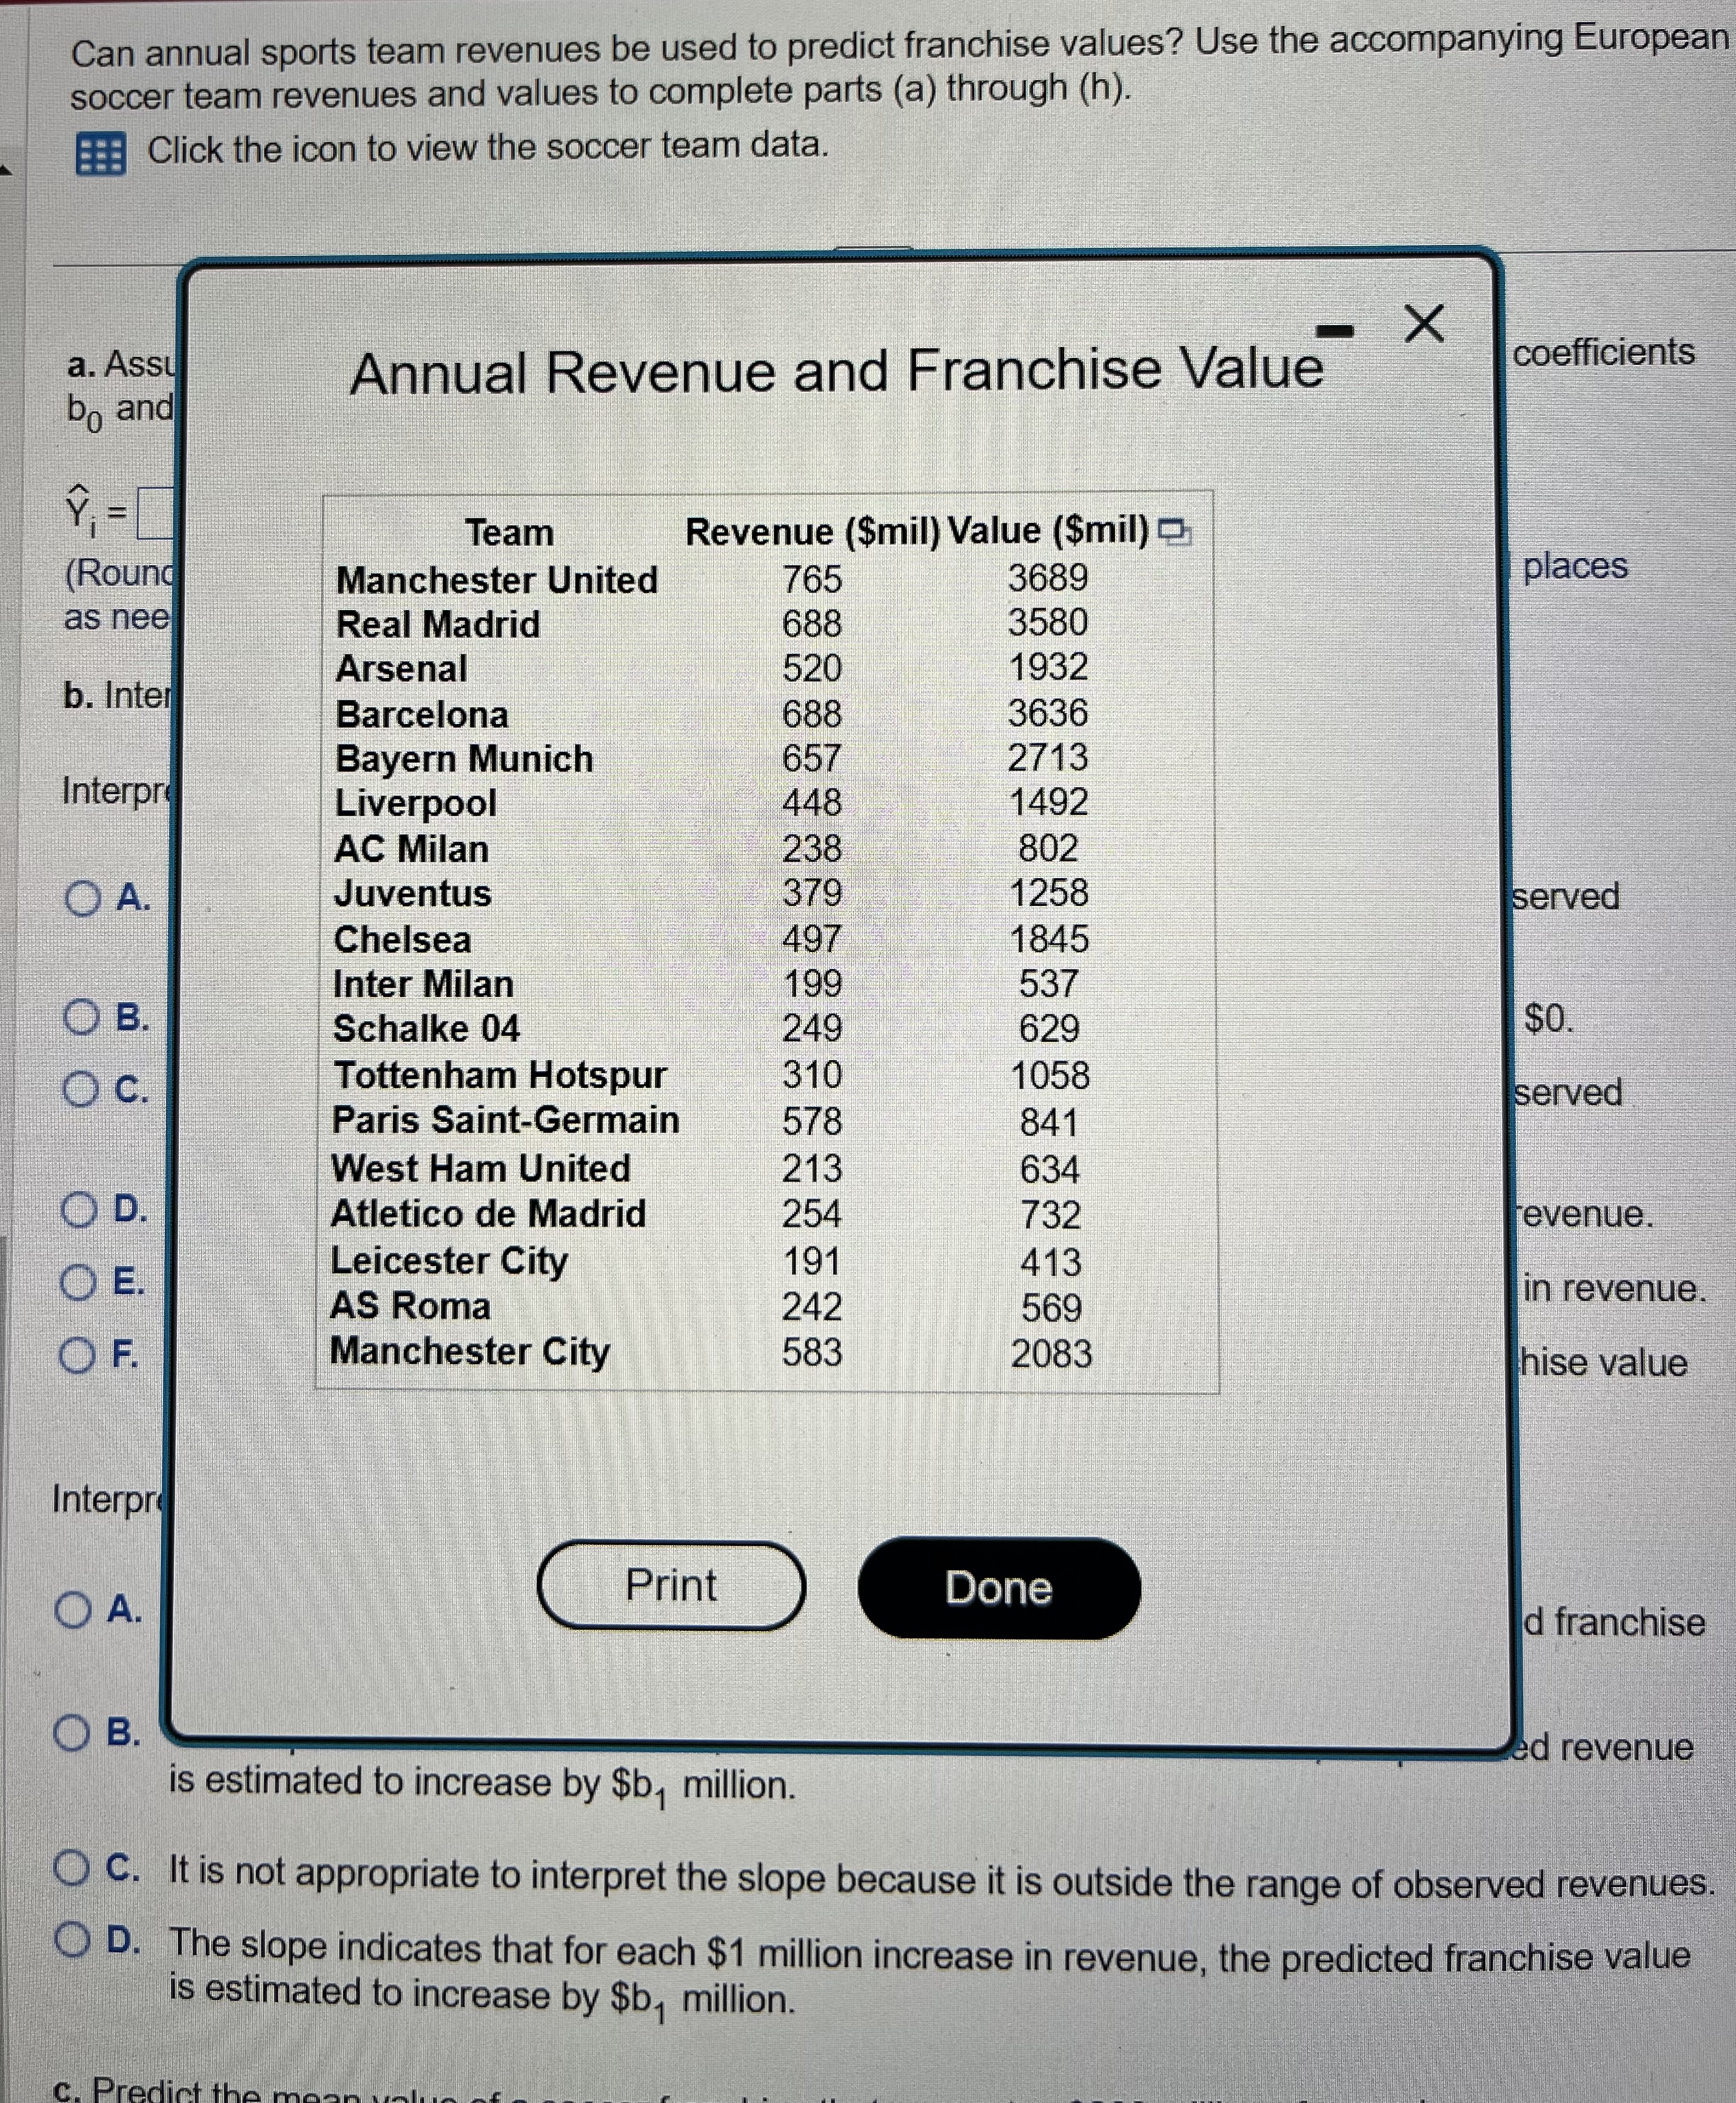
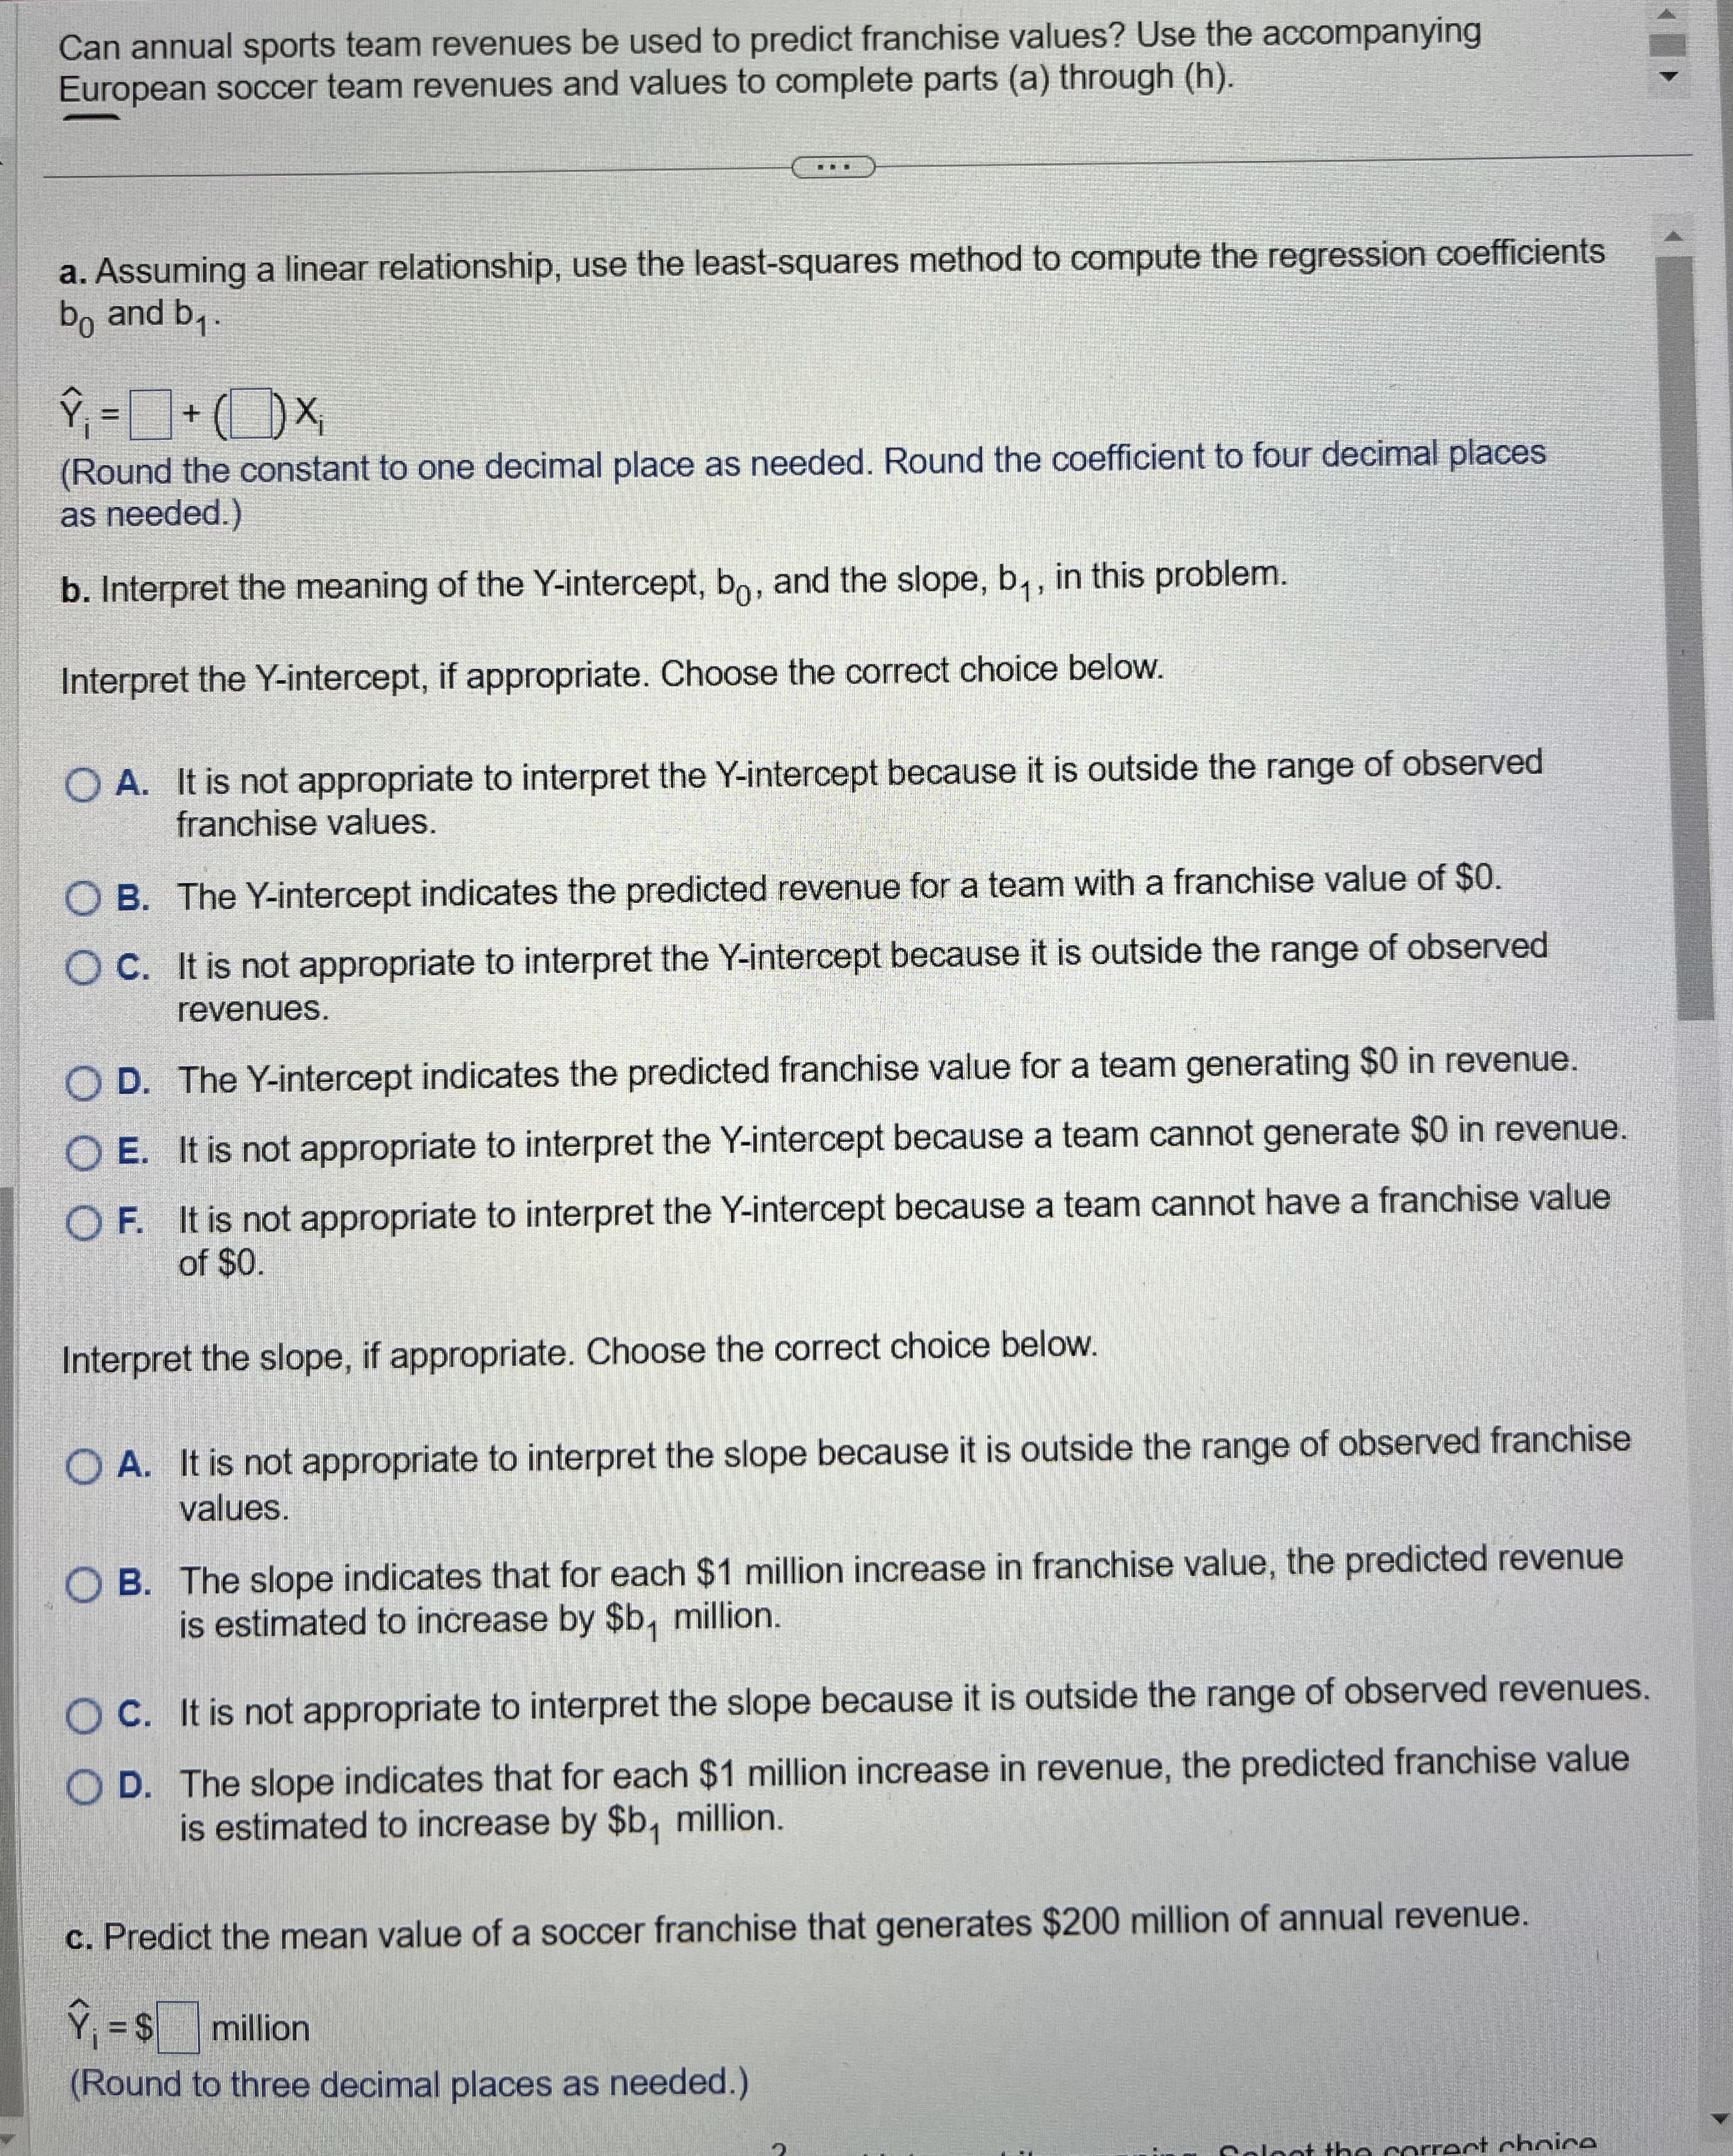
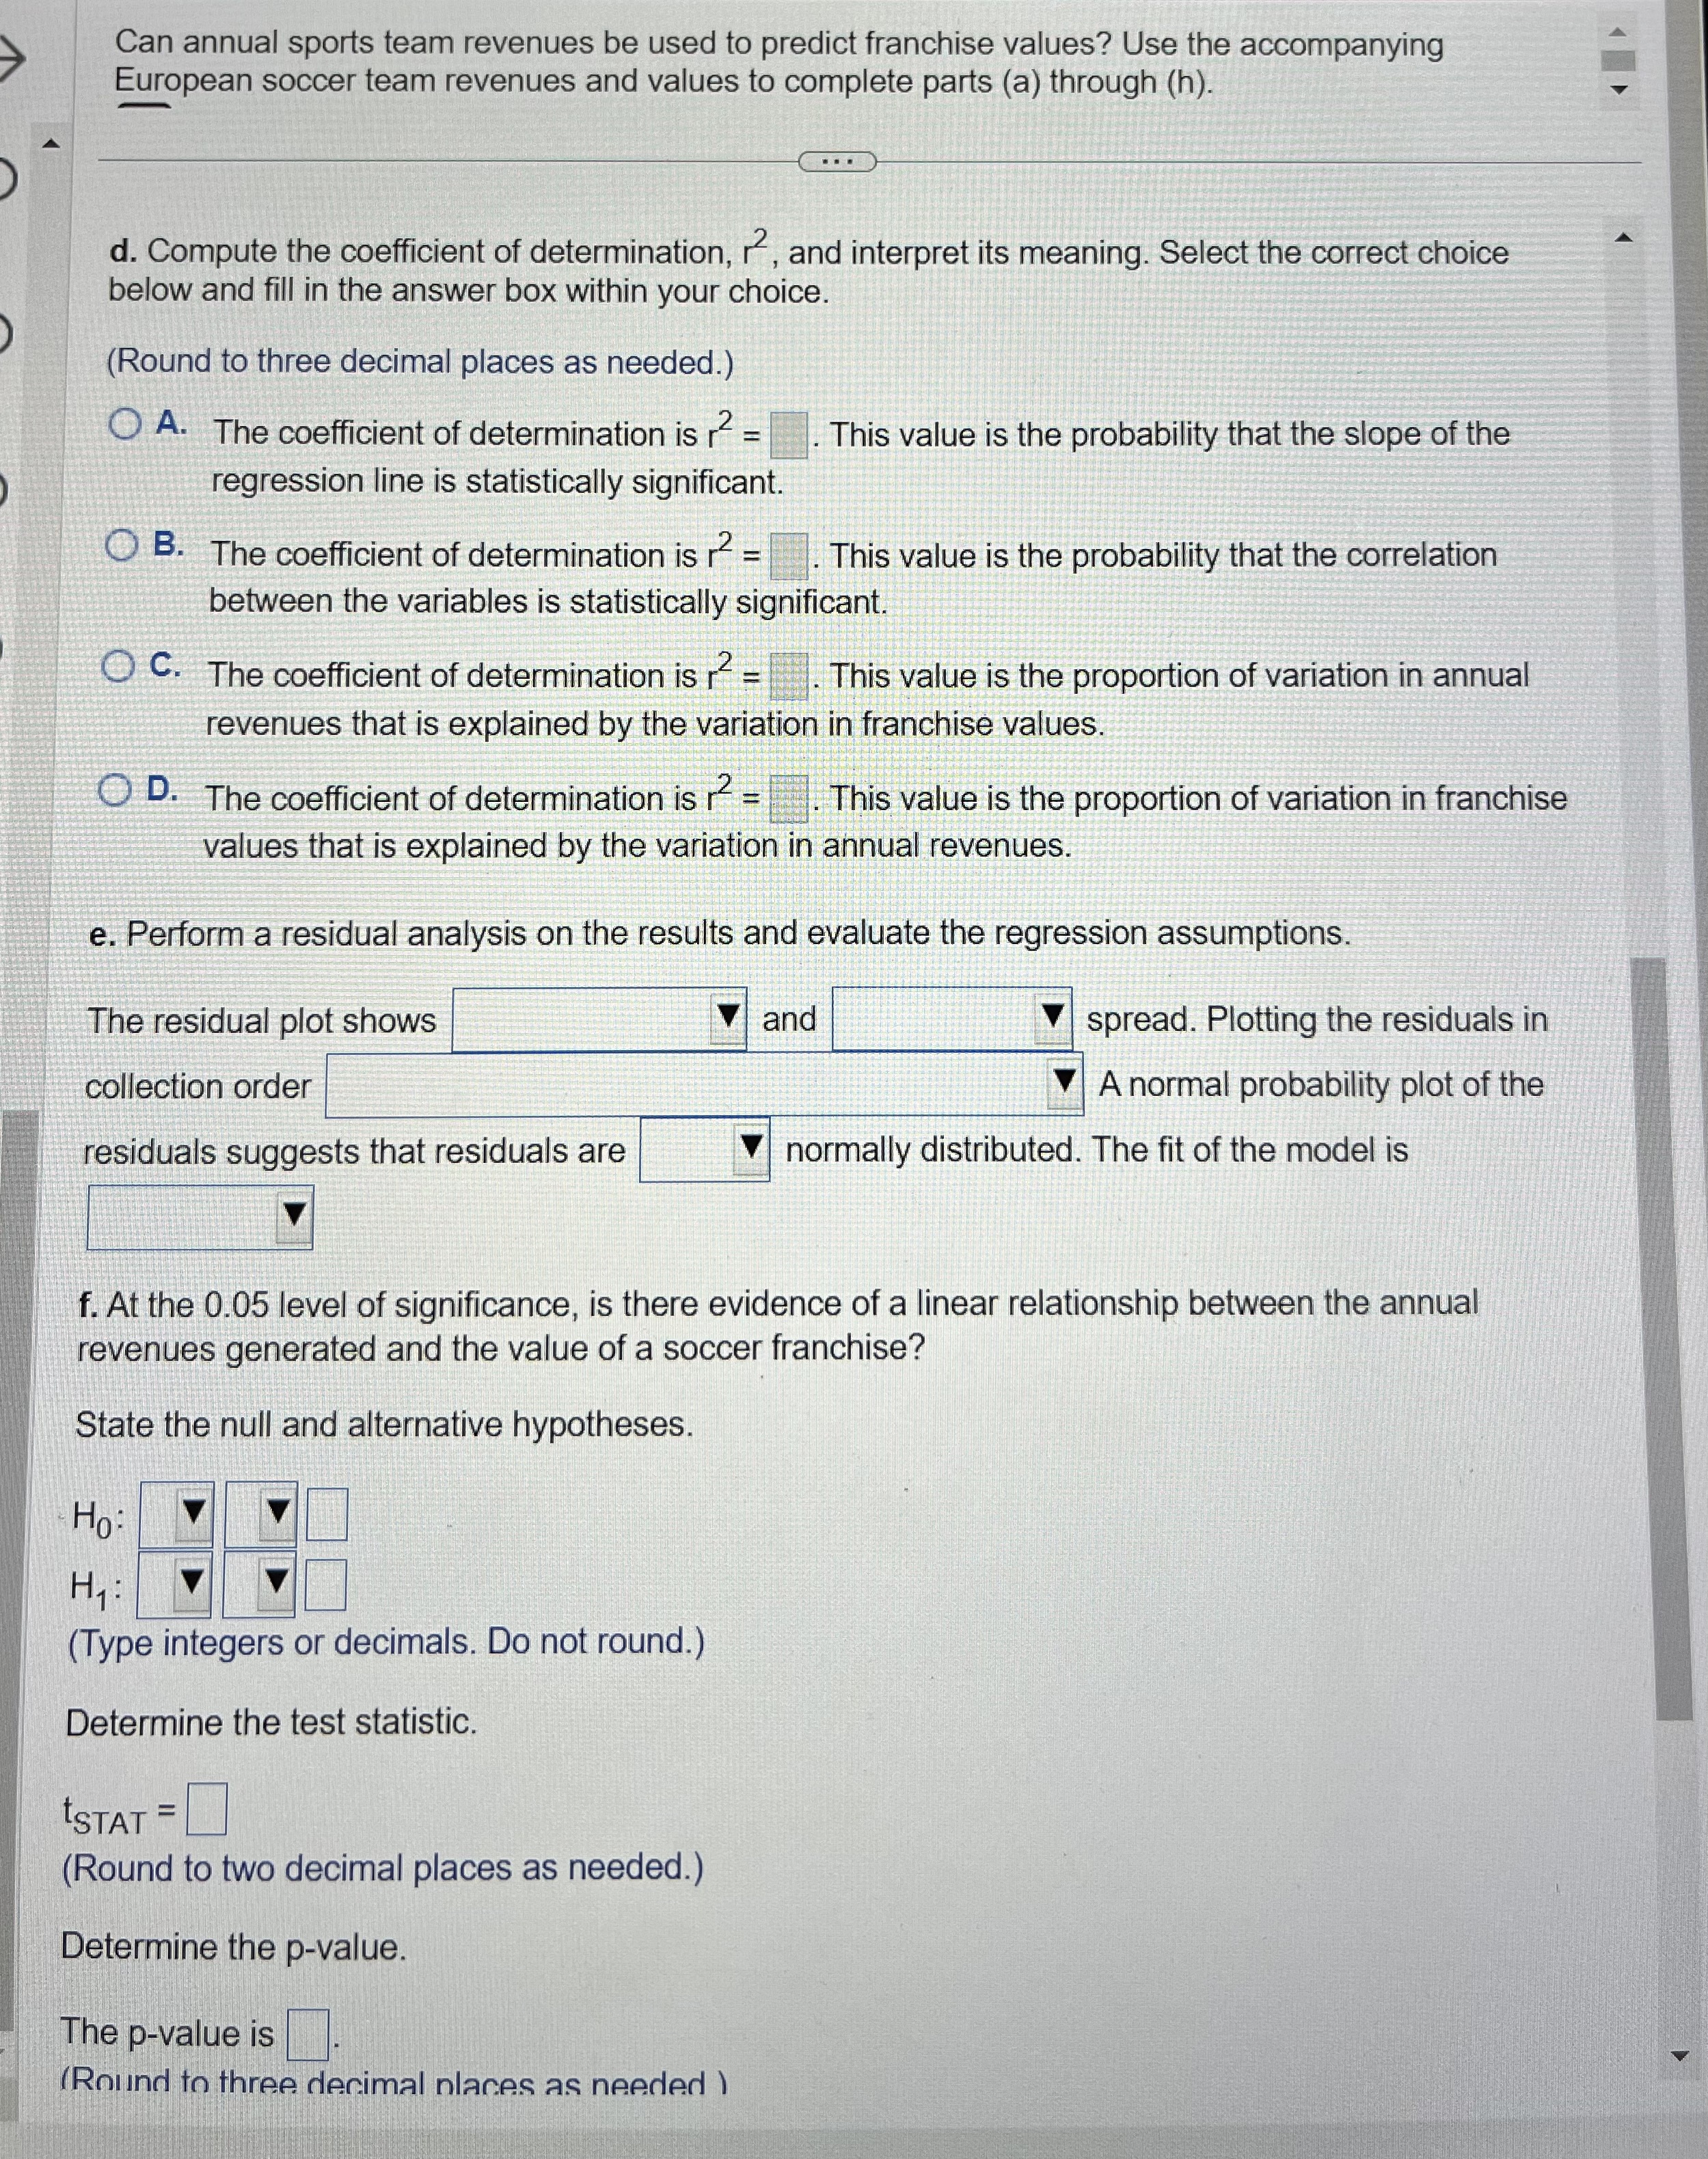
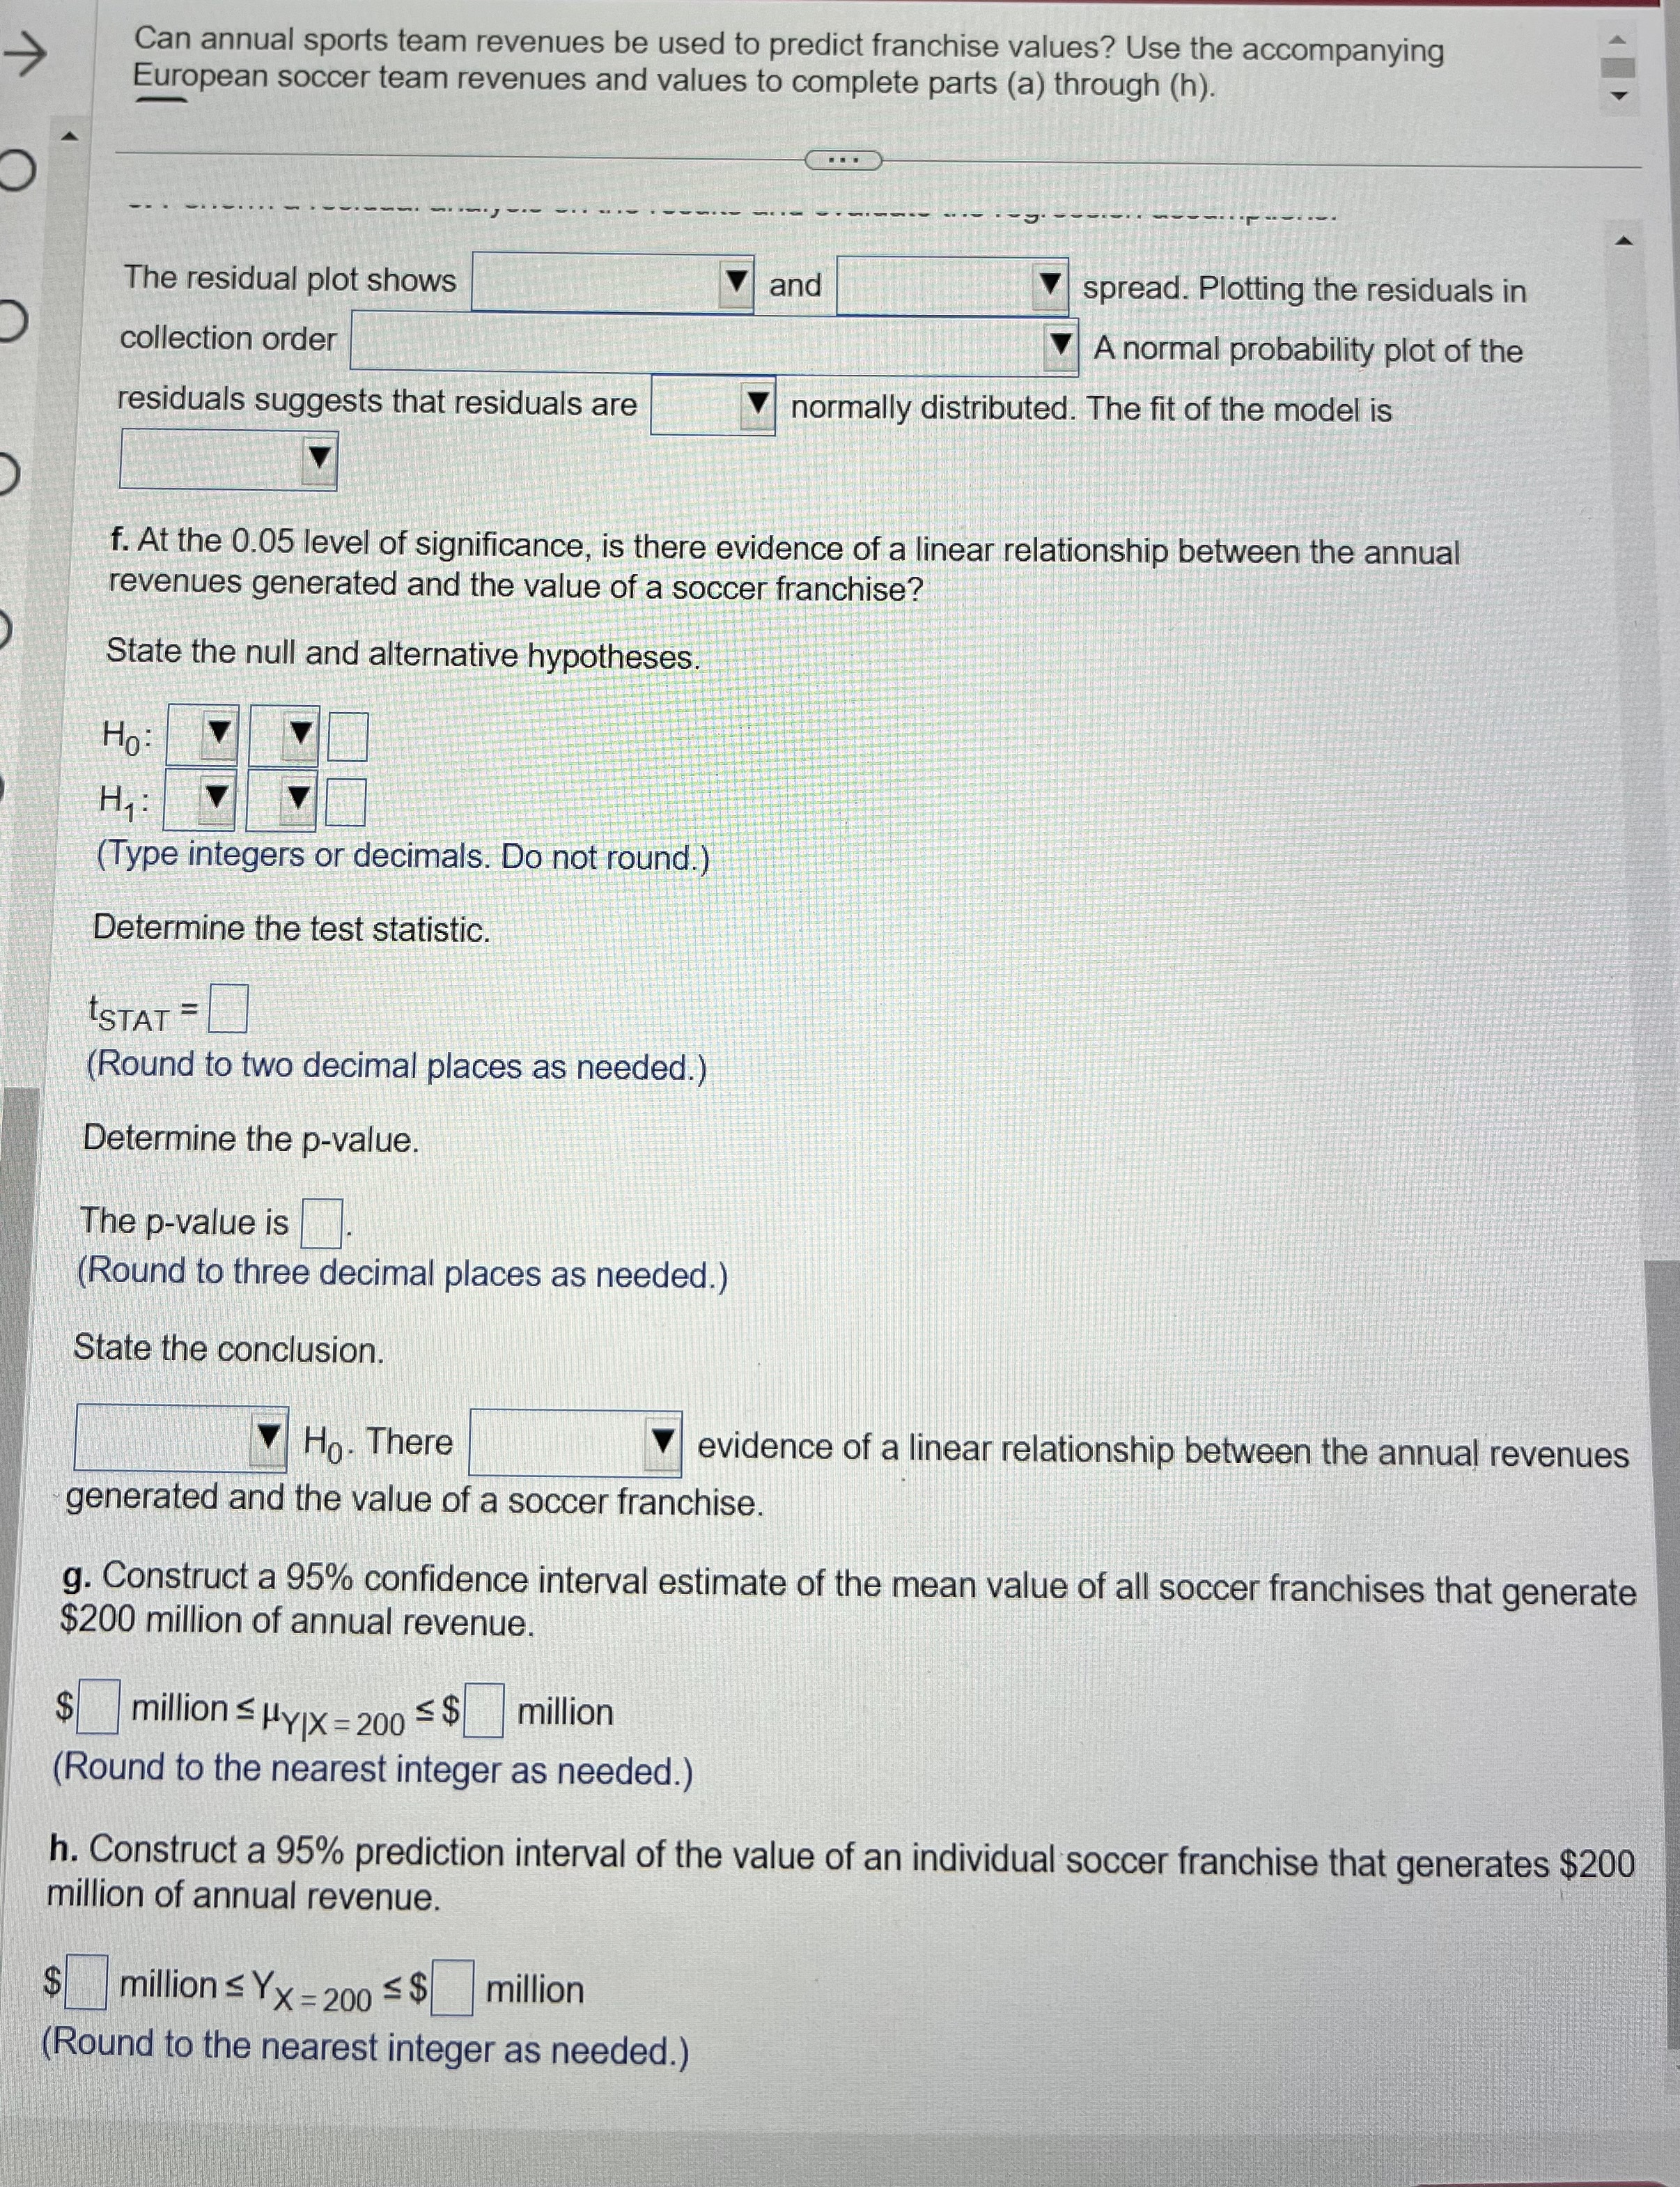
If SSE = 12 and SSR = 28, compute the coefficient of determination, , and interpret its meaning. 12 =(Type an integer or a decimal. Do not round.) Interpret the meaning of r. Choose the correct answer below. O A. It means that (1-r) . 100% of the variation in the independent variable cannot be explained by the variation in the dependent variable. O B. It means that r . 100% of the variation in the dependent variable can be explained by the variation in the independent variable. O C. It means that r of the variation in the independent variable can be explained by the variation in the dependent variable. O D. It means that 1 -r of the variation in the dependent variable cannot be explained by the variation in the independent variable.An agent for a real estate company in a large city would like to be able to predict the monthly rental cost __ for apartments, based on the size of the apartment, as defined by square footage. A sample of eight apartments in a neighborhood was selected, and the information gathered revealed the data shown below. For these data, the regression coefficients are b, =238.6399 and b, = 0.9698. Complete parts (a) through (d). Monthly Rent ($) 900 1,600 825 1,550 2,000 925 1,825 1,400 o = Size (Square Feet) 750 1,350 950 1,250 2,000 700 1,350 1,050 - - e a. Determine the coefficient of determination, r2, and interpret its meaning. = D (Round to three decimal places as needed.) What is the meaning of ?? OA r* measures the proportion of variation in monthly rent that can be explained by the variation in * apartment size. OB r? measures the proportion of variation in monthly rent that cannot be explained by the : * variation in apartment size. oc r* measures the proportion of variation in apartment size that cannot be explained by the : * variation in monthly rent. oD > measures the proportion of variation in apartment size that can be explained by the variation " in monthly rent. b. Determine the standard error of the estimate, Sy/y. Syx = D (Round to three decimal places as needed.) c. How useful is this model for predicting the monthly rent? It is very useful for predicting the monthly rent because r is close to 1 and Syx is fairly small O A. compared to the actual rents. It is very useful for predicting the monthly rent because r is close to 1. Syx does not indicate " whether a regression model is useful. It is not very useful for predicting the monthly rent because r* is close to 0 and Syx isfairly " small compared to the actual rents. i It is not very useful for predicting the monthly rent because although r is close to 1, Syx " fairlv small compared to the actual rents. An agent for a real estate company in a large city would like to be able to predict the monthly rental cost for apartments, based on the size of the apartment, as defined by square footage. A sample of eight apartments in a neighborhood was selected, and the information gathered revealed the data shown below. For these data, the regression coefficients are bo = 238.6399 and b, = 0.9698. Complete parts (a) through (d). Monthly Rent ($) 900 1,600 825 1,550 2,000 925 1,825 1,400 Size (Square Feet) 750 1,350 950 1,250 2,000 700 1,350 1,050 measures the proportion of variation in apartment size that cannot be explained by the variation in monthly rent. O D. measures the proportion of variation in apartment size that can be explained by the variation in monthly rent. b. Determine the standard error of the estimate, Syx- Syx = (Round to three decimal places as needed.) c. How useful is this model for predicting the monthly rent? It is very useful for predicting the monthly rent because r is close to 1 and Syx is fairly small O A. compared to the actual rents. OB. It is very useful for predicting the monthly rent because r is close to 1. Syx does not indicate whether a regression model is useful. It is not very useful for predicting the monthly rent because r is close to 0 and Syx is fairly O C. small compared to the actual rents. OD. It is not very useful for predicting the monthly rent because although is close to 1, Syx is fairly small compared to the actual rents. d. What other variables might explain the variation in monthly rent? Select all that apply. A. Whether tenants are allowed to keep pets B. The desirability of the apartment building's location C. The condition of the apartment D. The presence or absence of carpeting in the apartment WE. Whether parking is available to tenantsCan annual sports team revenues be used to predict franchise values? Use the accompanying European soccer team revenues and values to complete parts (a) through (h). Click the icon to view the soccer team data. X a. Assu Annual Revenue and Franchise Value coefficients bo and Y, = Team Revenue ($mil) Value ($mil) = (Round Manchester United 765 3689 places as nee Real Madrid 688 3580 Arsenal 520 1932 b. Inter Barcelona 688 3636 Bayern Munich 657 2713 Interpre Liverpool 448 1492 AC Milan 238 802 O A. Juventus 379 1258 served Chelsea 497 1845 Inter Milan 199 537 O B Schalke 04 249 629 $0 O c. Tottenham Hotspur 310 1058 served Paris Saint-Germain 578 841 West Ham United 213 634 OD. Atletico de Madrid 254 732 evenue. O E. Leicester City 191 413 AS Roma 242 569 in revenue OF. Manchester City 583 2083 hise value Interpre O A. Print Done d franchise O B. ed revenue is estimated to increase by $b, million. O C. It is not appropriate to interpret the slope because it is outside the range of observed revenues. O D. The slope indicates that for each $1 million increase in revenue, the predicted franchise value is estimated to increase by $b, million.Can annual sports team revenues be used to predict franchise values? Use the accompanying European soccer team revenues and values to complete parts (a) through (h). a. Assuming a linear relationship, use the least-squares method to compute the regression coefficients bo and b1 . Y , = [+ () x, (Round the constant to one decimal place as needed. Round the coefficient to four decimal places as needed.) b. Interpret the meaning of the Y-intercept, bo, and the slope, by , in this problem. Interpret the Y-intercept, if appropriate. Choose the correct choice below. A. It is not appropriate to interpret the Y-intercept because it is outside the range of observed franchise values O B. The Y-intercept indicates the predicted revenue for a team with a franchise value of $0. O C. It is not appropriate to interpret the Y-intercept because it is outside the range of observed revenues. O D. The Y-intercept indicates the predicted franchise value for a team generating $0 in revenue. O E. It is not appropriate to interpret the Y-intercept because a team cannot generate $0 in revenue. O F. It is not appropriate to interpret the Y-intercept because a team cannot have a franchise value of $0. Interpret the slope, if appropriate. Choose the correct choice below. A. It is not appropriate to interpret the slope because it is outside the range of observed franchise values. B. The slope indicates that for each $1 million increase in franchise value, the predicted revenue is estimated to increase by $b, million. O C. It is not appropriate to interpret the slope because it is outside the range of observed revenues. O D. The slope indicates that for each $1 million increase in revenue, the predicted franchise value is estimated to increase by $b, million. c. Predict the mean value of a soccer franchise that generates $200 million of annual revenue. Y, = $ million (Round to three decimal places as needed.)Can annual sports team revenues be used to predict franchise values? Use the accompanying European soccer team revenues and values to complete parts (a) through (h). d. Compute the coefficient of determination, r, and interpret its meaning. Select the correct choice below and fill in the answer box within your choice. (Round to three decimal places as needed.) A. The coefficient of determination is r = . This value is the probability that the slope of the regression line is statistically significant. B. The coefficient of determination is r = . This value is the probability that the correlation between the variables is statistically significant. C. The coefficient of determination is r = . This value is the proportion of variation in annual revenues that is explained by the variation in franchise values. O D. The coefficient of determination is = . This value is the proportion of variation in franchise values that is explained by the variation in annual revenues. e. Perform a residual analysis on the results and evaluate the regression assumptions. The residual plot shows and spread. Plotting the residuals in collection order A normal probability plot of the residuals suggests that residuals are |normally distributed. The fit of the model is f. At the 0.05 level of significance, is there evidence of a linear relationship between the annual revenues generated and the value of a soccer franchise? State the null and alternative hypotheses. Ho: H1 : (Type integers or decimals. Do not round.) Determine the test statistic. tSTAT = (Round to two decimal places as needed.) Determine the p-value. The p-value is. (Round to three decimal places as needed )Can annual sports team revenues be used to predict franchise values? Use the accompanying European soccer team revenues and values to complete parts (a) through (h). The residual plot shows and spread. Plotting the residuals in collection order A normal probability plot of the residuals suggests that residuals are normally distributed. The fit of the model is f. At the 0.05 level of significance, is there evidence of a linear relationship between the annual revenues generated and the value of a soccer franchise? State the null and alternative hypotheses Ho Type integers or decimals. Do not round.) Determine the test statistic. ISTAT = (Round to two decimal places as needed.) Determine the p-value. The p-value is. (Round to three decimal places as needed.) State the conclusion. Ho. There evidence of a linear relationship between the annual revenues generated and the value of a soccer franchise. g. Construct a 95% confidence interval estimate of the mean value of all soccer franchises that generate $200 million of annual revenue $ million SHYIX = 200 =$|million (Round to the nearest integer as needed.) h. Construct a 95% prediction interval of the value of an individual soccer franchise that generates $200 million of annual revenue. $ million s Yx = 200 =$ million Round to the nearest integer as needed.)
Step by Step Solution
There are 3 Steps involved in it
Step: 1
Get Instant Access to Expert-Tailored Solutions
See step-by-step solutions with expert insights and AI powered tools for academic success
Step: 2
Step: 3
Ace Your Homework with AI
Get the answers you need in no time with our AI-driven, step-by-step assistance