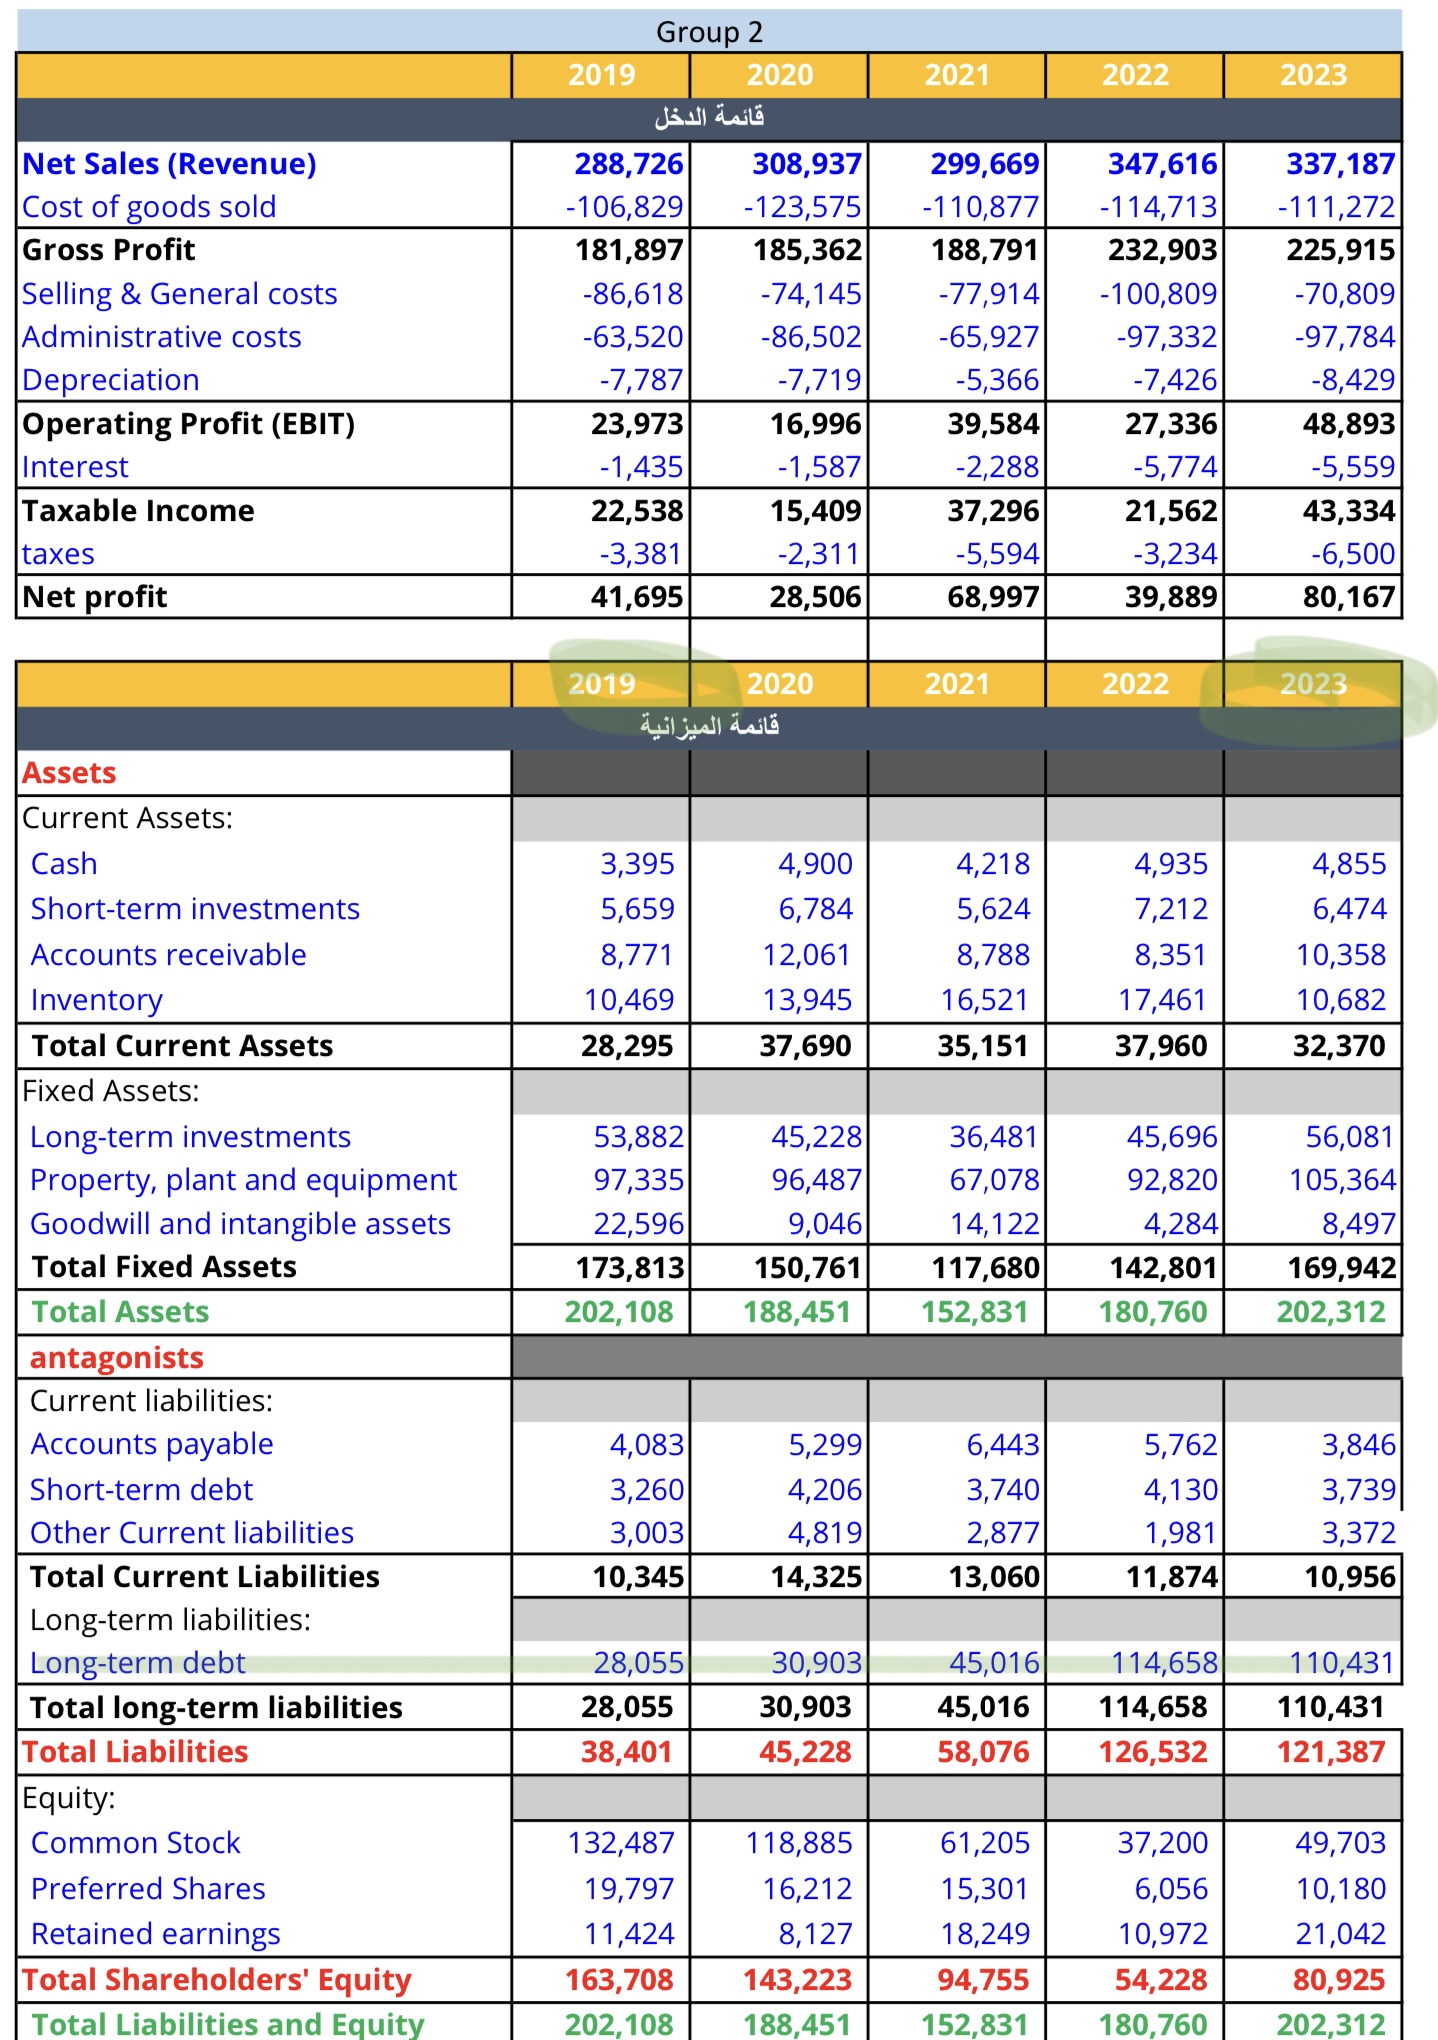
If the company wants to raise its long-term debt by 50% in 2024 in comparison to its long-term debt in 2023 by issuing bonds that pay a 5% coupon rate and have a maturity of 20 years, how many bonds must the company sell to achieve such a goal? .

\begin{tabular}{|c|c|c|c|c|c|} \hline \multicolumn{6}{|c|}{ Group 2} \\ \hline & 2019 & 2020 & 2021 & 2022 & 2023 \\ \hline \\ \hline Net Sales (Revenue) & 288,726 & 308,937 & 299,669 & 347,616 & 337,187 \\ \hline Cost of goods sold & 106,829 & 123,575 & 110,877 & 114,713 & 111,272 \\ \hline Gross Profit & 181,897 & 185,362 & 188,791 & 232,903 & 225,915 \\ \hline Selling \& General costs & 86,618 & 74,145 & 77,914 & 100,809 & 70,809 \\ \hline Administrative costs & 63,520 & 86,502 & 65,927 & 97,332 & 97,784 \\ \hline Depreciation & 7,787 & 7,719 & 5,366 & 7,426 & 8,429 \\ \hline Operating Profit (EBIT) & 23,973 & 16,996 & 39,584 & 27,336 & 48,893 \\ \hline Interest & 1,435 & 1,587 & 2,288 & 5,774 & 5,559 \\ \hline Taxable Income & 22,538 & 15,409 & 37,296 & 21,562 & 43,334 \\ \hline taxes & 3,381 & 2,311 & 5,594 & 3,234 & 6,500 \\ \hline Net profit & 41,695 & 28,506 & 68,997 & 39,889 & 80,167 \\ \hline & & & & & \\ \hline & 2019 & 2020 & 2021 & 2022 & 2023 \\ \hline \multicolumn{6}{|c|}{ } \\ \hline \multicolumn{6}{|l|}{ Assets } \\ \hline \multicolumn{6}{|l|}{ Current Assets: } \\ \hline Cash & 3,395 & 4,900 & 4,218 & 4,935 & 4,855 \\ \hline Short-term investments & 5,659 & 6,784 & 5,624 & 7,212 & 6,474 \\ \hline Accounts receivable & 8,771 & 12,061 & 8,788 & 8,351 & 10,358 \\ \hline Inventory & 10,469 & 13,945 & 16,521 & 17,461 & 10,682 \\ \hline Total Current Assets & 28,295 & 37,690 & 35,151 & 37,960 & 32,370 \\ \hline \multicolumn{6}{|l|}{ Fixed Assets: } \\ \hline Long-term investments & 53,882 & 45,228 & 36,481 & 45,696 & 56,081 \\ \hline Property, plant and equipment & 97,335 & 96,487 & 67,078 & 92,820 & 105,364 \\ \hline \multirow{2}{*}{\begin{tabular}{l} Goodwill and intangible assets \\ Total Fixed Assets \end{tabular}} & 22,596 & 9,046 & 14,122 & 4,284 & 8,497 \\ \hline & 173,813 & 150,761 & 117,680 & 142,801 & 169,942 \\ \hline Total Assets & 202,108 & 188,451 & 152,831 & 180,760 & 202,312 \\ \hline \multicolumn{6}{|l|}{\begin{tabular}{|l|} antagonists \\ \end{tabular}} \\ \hline \multicolumn{6}{|l|}{ Current liabilities: } \\ \hline Accounts payable & 4,083 & 5,299 & 6,443 & 5,762 & 3,846 \\ \hline Short-term debt & 3,260 & 4,206 & 3,740 & 4,130 & 3,739 \\ \hline Other Current liabilities & 3,003 & 4,819 & 2,877 & 1,981 & 3,372 \\ \hline \multirow{3}{*}{\begin{tabular}{l} Total Current Liabilities \\ Long-term liabilities: \\ Long-term debt \\ \end{tabular}} & 10,345 & 14,325 & 13,060 & 11,874 & 10,956 \\ \hline & & & & & \\ \hline & 28,055 & 30,903 & 45,016 & 114,658 & 110,431 \\ \hline Total long-term liabilities & 28,055 & 30,903 & 45,016 & 114,658 & 110,431 \\ \hline Total Liabilities & 38,401 & 45,228 & 58,076 & 126,532 & 121,387 \\ \hline \multicolumn{6}{|l|}{ Equity: } \\ \hline Common Stock & 132,487 & 118,885 & 61,205 & 37,200 & 49,703 \\ \hline Preferred Shares & 19,797 & 16,212 & 15,301 & 6,056 & 10,180 \\ \hline Retained earnings & 11,424 & 8,127 & 18,249 & 10,972 & 21,042 \\ \hline Total Shareholders' Equity & 163,708 & 143,223 & 94,755 & 54,228 & 80,925 \\ \hline & & 188451 & & & \\ \hline \end{tabular} \begin{tabular}{|c|c|c|c|c|c|} \hline \multicolumn{6}{|c|}{ Group 2} \\ \hline & 2019 & 2020 & 2021 & 2022 & 2023 \\ \hline \\ \hline Net Sales (Revenue) & 288,726 & 308,937 & 299,669 & 347,616 & 337,187 \\ \hline Cost of goods sold & 106,829 & 123,575 & 110,877 & 114,713 & 111,272 \\ \hline Gross Profit & 181,897 & 185,362 & 188,791 & 232,903 & 225,915 \\ \hline Selling \& General costs & 86,618 & 74,145 & 77,914 & 100,809 & 70,809 \\ \hline Administrative costs & 63,520 & 86,502 & 65,927 & 97,332 & 97,784 \\ \hline Depreciation & 7,787 & 7,719 & 5,366 & 7,426 & 8,429 \\ \hline Operating Profit (EBIT) & 23,973 & 16,996 & 39,584 & 27,336 & 48,893 \\ \hline Interest & 1,435 & 1,587 & 2,288 & 5,774 & 5,559 \\ \hline Taxable Income & 22,538 & 15,409 & 37,296 & 21,562 & 43,334 \\ \hline taxes & 3,381 & 2,311 & 5,594 & 3,234 & 6,500 \\ \hline Net profit & 41,695 & 28,506 & 68,997 & 39,889 & 80,167 \\ \hline & & & & & \\ \hline & 2019 & 2020 & 2021 & 2022 & 2023 \\ \hline \multicolumn{6}{|c|}{ } \\ \hline \multicolumn{6}{|l|}{ Assets } \\ \hline \multicolumn{6}{|l|}{ Current Assets: } \\ \hline Cash & 3,395 & 4,900 & 4,218 & 4,935 & 4,855 \\ \hline Short-term investments & 5,659 & 6,784 & 5,624 & 7,212 & 6,474 \\ \hline Accounts receivable & 8,771 & 12,061 & 8,788 & 8,351 & 10,358 \\ \hline Inventory & 10,469 & 13,945 & 16,521 & 17,461 & 10,682 \\ \hline Total Current Assets & 28,295 & 37,690 & 35,151 & 37,960 & 32,370 \\ \hline \multicolumn{6}{|l|}{ Fixed Assets: } \\ \hline Long-term investments & 53,882 & 45,228 & 36,481 & 45,696 & 56,081 \\ \hline Property, plant and equipment & 97,335 & 96,487 & 67,078 & 92,820 & 105,364 \\ \hline \multirow{2}{*}{\begin{tabular}{l} Goodwill and intangible assets \\ Total Fixed Assets \end{tabular}} & 22,596 & 9,046 & 14,122 & 4,284 & 8,497 \\ \hline & 173,813 & 150,761 & 117,680 & 142,801 & 169,942 \\ \hline Total Assets & 202,108 & 188,451 & 152,831 & 180,760 & 202,312 \\ \hline \multicolumn{6}{|l|}{\begin{tabular}{|l|} antagonists \\ \end{tabular}} \\ \hline \multicolumn{6}{|l|}{ Current liabilities: } \\ \hline Accounts payable & 4,083 & 5,299 & 6,443 & 5,762 & 3,846 \\ \hline Short-term debt & 3,260 & 4,206 & 3,740 & 4,130 & 3,739 \\ \hline Other Current liabilities & 3,003 & 4,819 & 2,877 & 1,981 & 3,372 \\ \hline \multirow{3}{*}{\begin{tabular}{l} Total Current Liabilities \\ Long-term liabilities: \\ Long-term debt \\ \end{tabular}} & 10,345 & 14,325 & 13,060 & 11,874 & 10,956 \\ \hline & & & & & \\ \hline & 28,055 & 30,903 & 45,016 & 114,658 & 110,431 \\ \hline Total long-term liabilities & 28,055 & 30,903 & 45,016 & 114,658 & 110,431 \\ \hline Total Liabilities & 38,401 & 45,228 & 58,076 & 126,532 & 121,387 \\ \hline \multicolumn{6}{|l|}{ Equity: } \\ \hline Common Stock & 132,487 & 118,885 & 61,205 & 37,200 & 49,703 \\ \hline Preferred Shares & 19,797 & 16,212 & 15,301 & 6,056 & 10,180 \\ \hline Retained earnings & 11,424 & 8,127 & 18,249 & 10,972 & 21,042 \\ \hline Total Shareholders' Equity & 163,708 & 143,223 & 94,755 & 54,228 & 80,925 \\ \hline & & 188451 & & & \\ \hline \end{tabular}


