 If the null hypothesis is true as an equality, the sampling distribution of x x is approximated by distribution with and a standard deviation of .
A. An unknown, a normal, a binomial, a t, a standard deviation.
B. A mean of 0, an unknown mean, a mean of 731, a mean of 747.
C. 1.0, unknown, 7.6 76
The value of the standardized test statistic is .
D. Z= 16, Z=2.11, t=2.11, z=747
 The p-value is .
E. 16, 2.11, .9826, .0174
Using the critical value approach, the null hypothesis is , because . Using the p-value approach, the null hypothesis is , because . Therefore, you conclude that banks have tightened their standards for issuing credit cards since 2002.
F. Rejected, Not rejected
G. 747> 731, .0174<.05>1.645, 2.11>1.645
H. Not Rejected, Rejected
I. 2.11> 1.645, 0.0143 0.05, 0.0174
j. cannot, Can

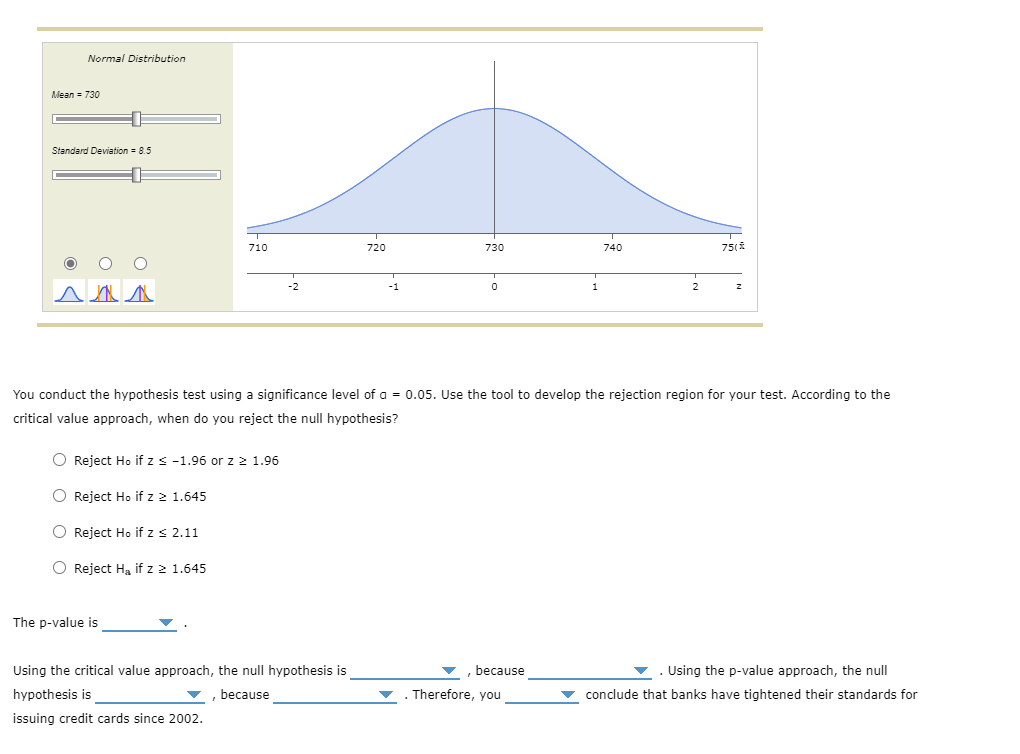
2. Hypothesis tests about a population mean, population standard deviation known Lenders tighten or loosen their standards for issuing credit as economic conditions change. One of the criteria lenders use to evaluate the creditworthiness of a potential borrower is her credit risk score, usually a FICO score. FICO scores range from 300 to 850 . A consumer with a high FICO score is perceived to be a low credit risk to the lender and is more likely to be extended credit than a consumer with a low score. A credit card represents a line of credit, because the credit card holder obtains a loan whenever the card is used to pay for a purchase. A study of credit card accounts opened in 2002 found a mean FICO score for the credit card holder (at the time the card was issued) of 731 and a standard deviation of 76. [Source: Sumit Agarwal, John C. Driscoll, Xavier Gabaix, and David Laibson, "Learning in the Credit Card Market," Working Paper 13822, National Bureau of Economic Research (NBER), February 2008.] You conduct a hypothesis test to determine whether banks have tightened their standards for issuing credit cards since 2002 . You collect a random sample of 100 credit cards issued during the past 6 months. The sample mean FICO score of the credit card holders (at the time their cards were issued) is x=747. Assume that the standard deviation of the population of FICO scores for credit cards issued during the past 6 months is known to be =76, the standard deviation from the NBER study. Let equal the true population mean FICO score for consumers issued credit cards in the past 6 months. You should formulate the null and alternative hypotheses as: H0:731,Ha:731,Ha:731H0:x731,Ha:x>731H0:731,Ha:>731 If the null hypothesis is true as an equality, the sampling distribution of x is approximated by distribution with and a standard deviation of The value of the standardized test statistic is Use the Distributions tool to help you answer the questions that follow. Normal Distribution Mean =730 Standard Deviation =8.5 You conduct the hypothesis test using a significance level of a =0.05. Use the tool to develop the rejection region for your test. According to the critical value approach, when do you reject the null hypothesis? Reject H0 if z1.96 or z1.96 Reject Ho0 if z1.645 Reject H0 if z2.11 Reject Ha if z1.645 The p-value is Using the critical value approach, the null hypothesis is , because - Using the p-value approach, the null hypothesis is , because - Therefore, you conclude that banks have tightened their standards for issuing credit cards since 2002. A finance professor conducts a statistical study to test her hunch that the mean return on common-stock portfolios is lower with a trading strategy than with a buy-and-hold strategy. The professor formulates the null hypothesis as: The mean return on common-stock portfolios is higher or the same with a trading strategy as opposed to a buy-and-hold strategy. The mean return on common-stock portfolios is the same with a trading strategy as with a buy-and-hold strategy. The mean return on common-stock portfolios is lower with a trading strategy than with a buy-and-hold strategy. The mean return on common-stock portfolios is higher with a trading strategy than with a buy-and-hold strategy
 If the null hypothesis is true as an equality, the sampling distribution of x x is approximated by distribution with and a standard deviation of .
 The p-value is .


