If the portfolio was equally weighted (20% in all stocks and ETF) what is the resulting portfolio position (risk and return)? How does the variability of each stock affect the portfolio? How does thi relate to your answer in question 1 above? How would the portfolio risk and return change if 50% of it is in SBUX, 20% in SPY, and 10% in each of the remainder securities.
 s
s
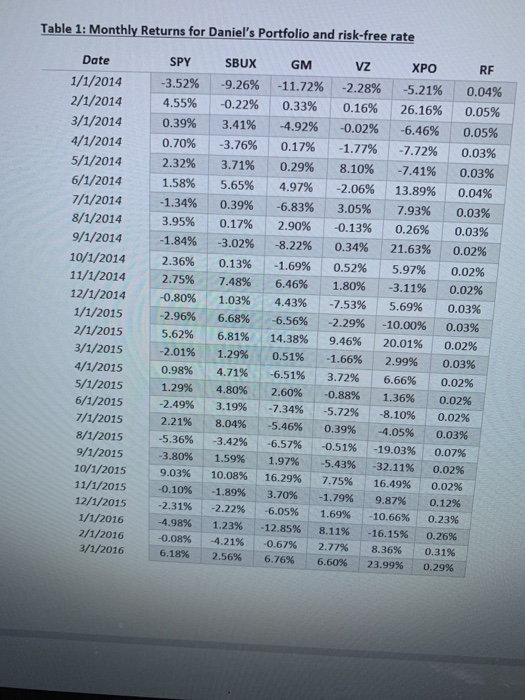
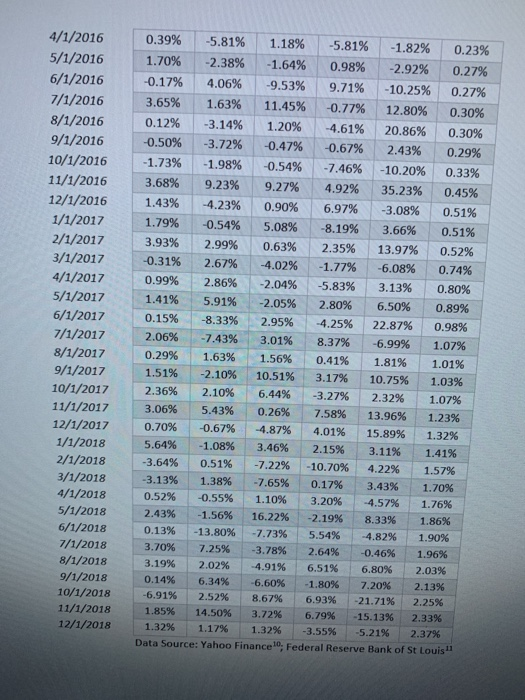
Table 1: Monthly Returns for Daniel's Portfolio and risk-free rate Date SPY SBUX GM XPO VZ RF 1/1/2014 -9.26% -11.72 % -3.52% -2.28% -5.21% 0.04% 2/1/2014 -0.22% 4.55% 0.33% 0.16% 26.16% 0.05% 3/1/2014 0.39% 3.41 % -4.92 % -0.02 % -6.46% 0.05% 4/1/2014 0.17 % 0.70% -3.76% -7.72 % -1.77% 0.03% 5/1/2014 2.32% 3.71% 0.29% 8.10% -7.41 % 0.03% 6/1/2014 1.58% 5.65% 4.97% -2.06% 13.89% 0.04% 7/1/2014 -1.34% 0.39% -6.83 % 3.05% 0.03% 7.93% 8/1/2014 3.95% 0.17 % 2.90% -0.13 % 0.26% 0.03% 9/1/2014 -1.84% -3.02 % -8.22 % 0.34% 21.63% 0.02 % 10/1/2014 0.13 % 2.36% -1.69% 0.52% 5.97% 0.02% 11/1/2014 12/1/2014 2.75% 7.48% 6.46% 1.80% -3.11% 0.02% -0.80% 1.03% 4.43% -7.53% 5.69% 0.03% 1/1/2015 -2.96 % 6.68% -6.56% -2.29 % -10.00 % 0.03% 2/1/2015 5.62% 6.81% 14.38% 9.46% 20.01% 0.02% 3/1/2015 -2.01 % 1.29% 0.51% -1.66% 2.99% 0.03% 4/1/2015 0.98% 4.71% -6.51 % 3.72% 6.66% 0.02% 5/1/2015 1.29% 4.80% 2.60% -0.88% 1.36% 0.02% 6/1/2015 -2.49 % 3.19% -7.34% -8.10 % -5.72% 0.02% 7/1/2015 2.21% 8.04% -5.46% 0.39% -4.05% 0.03 % 8/1/2015 -5.36 % -3.42% -6.57 % -0.51 % -19.03% 0.07% 9/1/2015 -3.80% 1.59% 1.97% -5.43% -32.11 % 0.02% 10/1/2015 9.03% 10.08% 16.29% 7.75% 16.49% 0.02% 11/1/2015 -0.10 % -2.31 % -1.89 % 3.70% -1.79 % 9.87% 0.12% 12/1/2015 -6.05 % -2.22% 1.69% -10.66% 0.23% 1/1/2016 2/1/2016 -4.98% 1.23% -12.85% 8.11 % -16.15% 0.26% -0.08% -4.21 % -0.67 % 2.77% 8.36% 0.31% 3/1/2016 6.18% 2.56% 6.76 % 6.60% 23.99% 0.29% 4/1/2016 0.39% -5.81 % 1.18% -5.81% -1.82% 0.23% 5/1/2016 1.70% -2.38% -1.64% 0.98% -2.92% 0.27 % 6/1/2016 -0.17 % 4.06% -9.53% 9.71% -10.25% 0.27% 7/1/2016 3.65% 1.63% 11.45% -0.77 % 12.80% 0.30% 8/1/2016 0.12% -3.14% 1.20% -4.61 % 20.86% 0.30% 9/1/2016 -0.50 % -3.72% -0.47 % -0.67 % 2.43% 0.29 % 10/1/2016 -1.73% -1.98 % -0.54 % -7.46% -10.20% 0.33% 11/1/2016 3.68% 9.23% 9,27% 4.92% 35.23% 0.45% 12/1/2016 1.43% -4.23 % 0.90% 6.97% -3.08% 0.51% 1/1/2017 1.79% -0.54% 5.08% -8.19 % 3.66% 0.51% 2/1/2017 3.93% 2.99% 0.63% 2.35% 13.97% 0.52% 3/1/2017 -0.31 % 2.67% -4.02 % -1.77 % -6.08% 0.74% 4/1/2017 0.99% 2.86% -2.04 % -5.83% 3.13% 0.80% 5/1/2017 1.41% 5.91% -2.05% 2.80% 6.50% 0.89% 6/1/2017 0.15% -8.33% 2.95% -4.25% 22.87% 0.98% 7/1/2017 2.06% -7.43% 3.01% 8.37% -6.99 % 1.07% 8/1/2017 9/1/2017 10/1/2017 0.29% 1.63% 1.56% 0.41% 1.81% 1.01% 1.51% -2.10 % 10.51% 3.17% 10.75% 1.03% 2.36% 2.10% 6.44% -3.27 % 2.32% 1.07 % 11/1/2017 3.06% 5.43% 0.26% 7.58% 13.96% 1.23% 12/1/2017 0.70% -0.67 % -4.87 % 4.01% 15.89% 1.32% 1/1/2018 5.64% -1.08 % 3.46% 2.15 % 3.11% 1.41% 2/1/2018 -3.64% 0.51% -7.22 % -10.70 % 4.22% 1.57% 3/1/2018 4/1/2018 -3.13% 1.38% -7.65% 0.17 % 3.43% 1.70% 0.52% -0.55% 1.10% 3.20% -4.57% 1.76% 5/1/2018 2.43% -1.56 % 16.22% -2.19% 8.33% 1.86% 6/1/2018 0.13% -13.80% -7.73 % 5.54% -4.82% 1.90% 7/1/2018 3.70% 7.25% -3.78 % 2.64% -0.46 % 1.96% 8/1/2018 3.19% 2.02% -4.91 % 6.51% 6.80% 2.03% 9/1/2018 0.14% 6.34% -6.60 % -1.80% 7.20% 2.13% 10/1/2018 -6.91% 2.52% 8.67% -21.71 % 6.93% 2.25% 11/1/2018 1.85% 14.50% 3.72% -15.13 % 6.79% 2.33% 12/1/2018 1.32% 1.17 % 1.32% -3.55% -5.21 % 2.37% rce: Yahoo Finance10, Federal Reserve Bank of St Louis11 Data Table 1: Monthly Returns for Daniel's Portfolio and risk-free rate Date SPY SBUX GM XPO VZ RF 1/1/2014 -9.26% -11.72 % -3.52% -2.28% -5.21% 0.04% 2/1/2014 -0.22% 4.55% 0.33% 0.16% 26.16% 0.05% 3/1/2014 0.39% 3.41 % -4.92 % -0.02 % -6.46% 0.05% 4/1/2014 0.17 % 0.70% -3.76% -7.72 % -1.77% 0.03% 5/1/2014 2.32% 3.71% 0.29% 8.10% -7.41 % 0.03% 6/1/2014 1.58% 5.65% 4.97% -2.06% 13.89% 0.04% 7/1/2014 -1.34% 0.39% -6.83 % 3.05% 0.03% 7.93% 8/1/2014 3.95% 0.17 % 2.90% -0.13 % 0.26% 0.03% 9/1/2014 -1.84% -3.02 % -8.22 % 0.34% 21.63% 0.02 % 10/1/2014 0.13 % 2.36% -1.69% 0.52% 5.97% 0.02% 11/1/2014 12/1/2014 2.75% 7.48% 6.46% 1.80% -3.11% 0.02% -0.80% 1.03% 4.43% -7.53% 5.69% 0.03% 1/1/2015 -2.96 % 6.68% -6.56% -2.29 % -10.00 % 0.03% 2/1/2015 5.62% 6.81% 14.38% 9.46% 20.01% 0.02% 3/1/2015 -2.01 % 1.29% 0.51% -1.66% 2.99% 0.03% 4/1/2015 0.98% 4.71% -6.51 % 3.72% 6.66% 0.02% 5/1/2015 1.29% 4.80% 2.60% -0.88% 1.36% 0.02% 6/1/2015 -2.49 % 3.19% -7.34% -8.10 % -5.72% 0.02% 7/1/2015 2.21% 8.04% -5.46% 0.39% -4.05% 0.03 % 8/1/2015 -5.36 % -3.42% -6.57 % -0.51 % -19.03% 0.07% 9/1/2015 -3.80% 1.59% 1.97% -5.43% -32.11 % 0.02% 10/1/2015 9.03% 10.08% 16.29% 7.75% 16.49% 0.02% 11/1/2015 -0.10 % -2.31 % -1.89 % 3.70% -1.79 % 9.87% 0.12% 12/1/2015 -6.05 % -2.22% 1.69% -10.66% 0.23% 1/1/2016 2/1/2016 -4.98% 1.23% -12.85% 8.11 % -16.15% 0.26% -0.08% -4.21 % -0.67 % 2.77% 8.36% 0.31% 3/1/2016 6.18% 2.56% 6.76 % 6.60% 23.99% 0.29% 4/1/2016 0.39% -5.81 % 1.18% -5.81% -1.82% 0.23% 5/1/2016 1.70% -2.38% -1.64% 0.98% -2.92% 0.27 % 6/1/2016 -0.17 % 4.06% -9.53% 9.71% -10.25% 0.27% 7/1/2016 3.65% 1.63% 11.45% -0.77 % 12.80% 0.30% 8/1/2016 0.12% -3.14% 1.20% -4.61 % 20.86% 0.30% 9/1/2016 -0.50 % -3.72% -0.47 % -0.67 % 2.43% 0.29 % 10/1/2016 -1.73% -1.98 % -0.54 % -7.46% -10.20% 0.33% 11/1/2016 3.68% 9.23% 9,27% 4.92% 35.23% 0.45% 12/1/2016 1.43% -4.23 % 0.90% 6.97% -3.08% 0.51% 1/1/2017 1.79% -0.54% 5.08% -8.19 % 3.66% 0.51% 2/1/2017 3.93% 2.99% 0.63% 2.35% 13.97% 0.52% 3/1/2017 -0.31 % 2.67% -4.02 % -1.77 % -6.08% 0.74% 4/1/2017 0.99% 2.86% -2.04 % -5.83% 3.13% 0.80% 5/1/2017 1.41% 5.91% -2.05% 2.80% 6.50% 0.89% 6/1/2017 0.15% -8.33% 2.95% -4.25% 22.87% 0.98% 7/1/2017 2.06% -7.43% 3.01% 8.37% -6.99 % 1.07% 8/1/2017 9/1/2017 10/1/2017 0.29% 1.63% 1.56% 0.41% 1.81% 1.01% 1.51% -2.10 % 10.51% 3.17% 10.75% 1.03% 2.36% 2.10% 6.44% -3.27 % 2.32% 1.07 % 11/1/2017 3.06% 5.43% 0.26% 7.58% 13.96% 1.23% 12/1/2017 0.70% -0.67 % -4.87 % 4.01% 15.89% 1.32% 1/1/2018 5.64% -1.08 % 3.46% 2.15 % 3.11% 1.41% 2/1/2018 -3.64% 0.51% -7.22 % -10.70 % 4.22% 1.57% 3/1/2018 4/1/2018 -3.13% 1.38% -7.65% 0.17 % 3.43% 1.70% 0.52% -0.55% 1.10% 3.20% -4.57% 1.76% 5/1/2018 2.43% -1.56 % 16.22% -2.19% 8.33% 1.86% 6/1/2018 0.13% -13.80% -7.73 % 5.54% -4.82% 1.90% 7/1/2018 3.70% 7.25% -3.78 % 2.64% -0.46 % 1.96% 8/1/2018 3.19% 2.02% -4.91 % 6.51% 6.80% 2.03% 9/1/2018 0.14% 6.34% -6.60 % -1.80% 7.20% 2.13% 10/1/2018 -6.91% 2.52% 8.67% -21.71 % 6.93% 2.25% 11/1/2018 1.85% 14.50% 3.72% -15.13 % 6.79% 2.33% 12/1/2018 1.32% 1.17 % 1.32% -3.55% -5.21 % 2.37% rce: Yahoo Finance10, Federal Reserve Bank of St Louis11 Data