if the type of test statistic is t or f can you also add the df and/or the dfn dfd for t? you can use a TI 84.
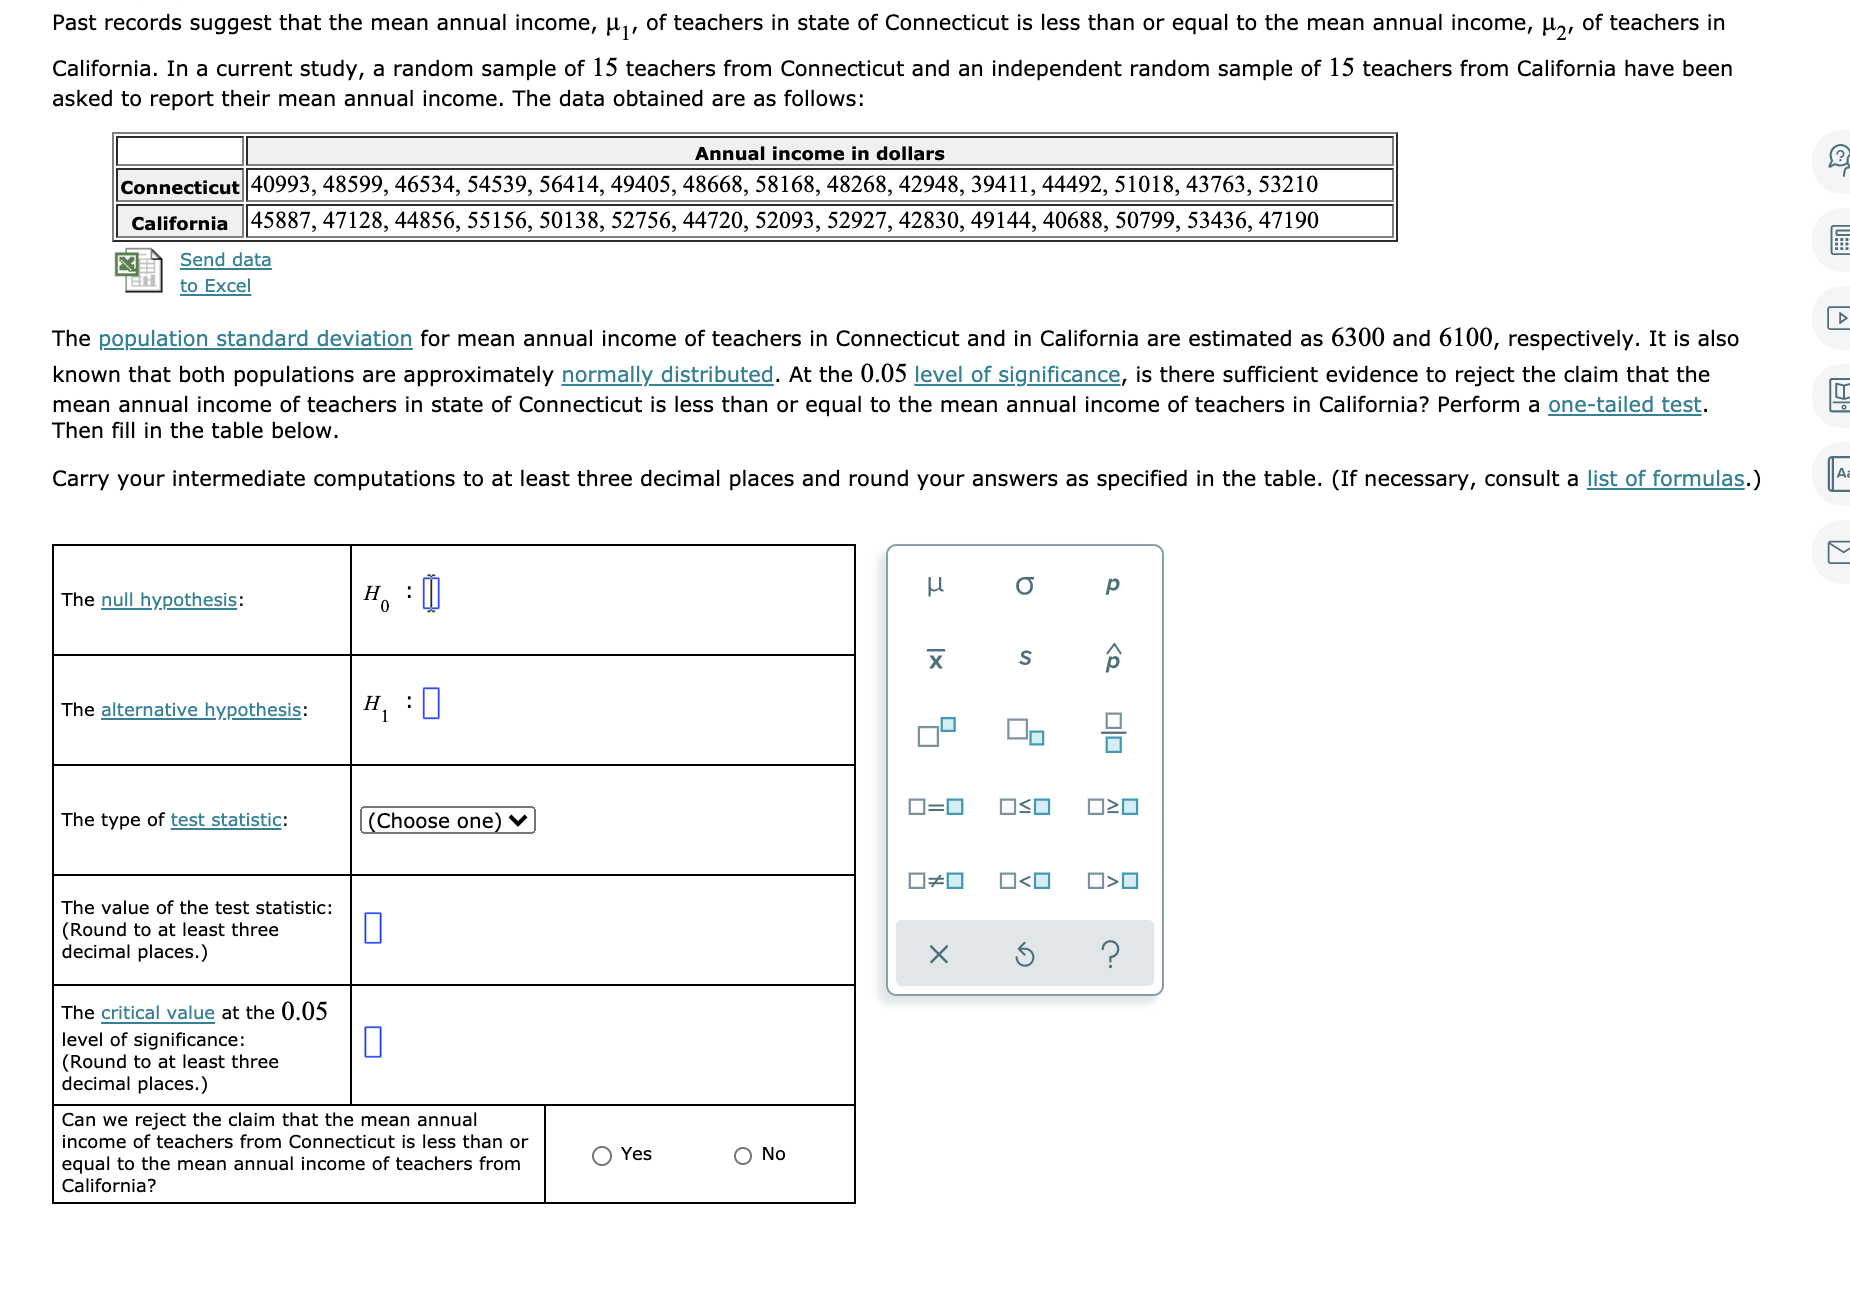
Past records suggest that the mean annual income, [41, of teachers in state of Connecticut is less than or equal to the mean annual income, p2, of teachers in California. In a current study, a random sample of 15 teachers from Connecticut and an independent random sample of 15 teachers from California have been asked to report their mean annual income. The data obtained are as follows: II Annual income in dollars Connecticutll40993, 48599, 46534, 54539, 56414, 49405, 48668, 58168, 48268, 42948, 39411, 44492, 51018, 43763, 53210 California 45887, 47128, 44856, 55156, 50138, 52756, 44720, 52093, 52927, 42830, 49144, 40688, 50799, 53436, 47190 % Send data to Excel The p_opulation standard deviation for mean annual income of teachers in Connecticut and in California are estimated as 6300 and 6100, respectively. It is also known that both populations are approximately normally distributed. At the 0.05 level of significance, is there sufficient evidence to reject the claim that the mean annual income of teachers in state of Connecticut is less than or equal to the mean annual income of teachers in California? Perform a onetailed test. Then ll in the table below. Carry your intermediate computations to at least three decimal places and round your answers as specied in the table. (If necessary, consult a list of formulas.) The null hypothesis: H0 : II] The alternative hypothesis: The type of test statistic: The value of the test statistic: (Round to at least three decimal places.) The critical value at the 0.05 level of signicance: E] (Round to at least three decimal places.) Can we reject the claim that the mean annual income of teachers from Connecticut is less than or equal to the mean annual income of teachers from 0 Yes 0 ND California? @l-Ilm l7l