Answered step by step
Verified Expert Solution
Link Copied!

Question

1 Approved Answer

If these graphs all show that they are left skewed, if you have a smaller population number you look at, shouldn't the graph still show

If these graphs all show that they are left skewed, if you have a smaller population number you look at, shouldn't the graph still show a left skew? Or Is it because it will be a smaller population, you have less variability and it would be uniform?
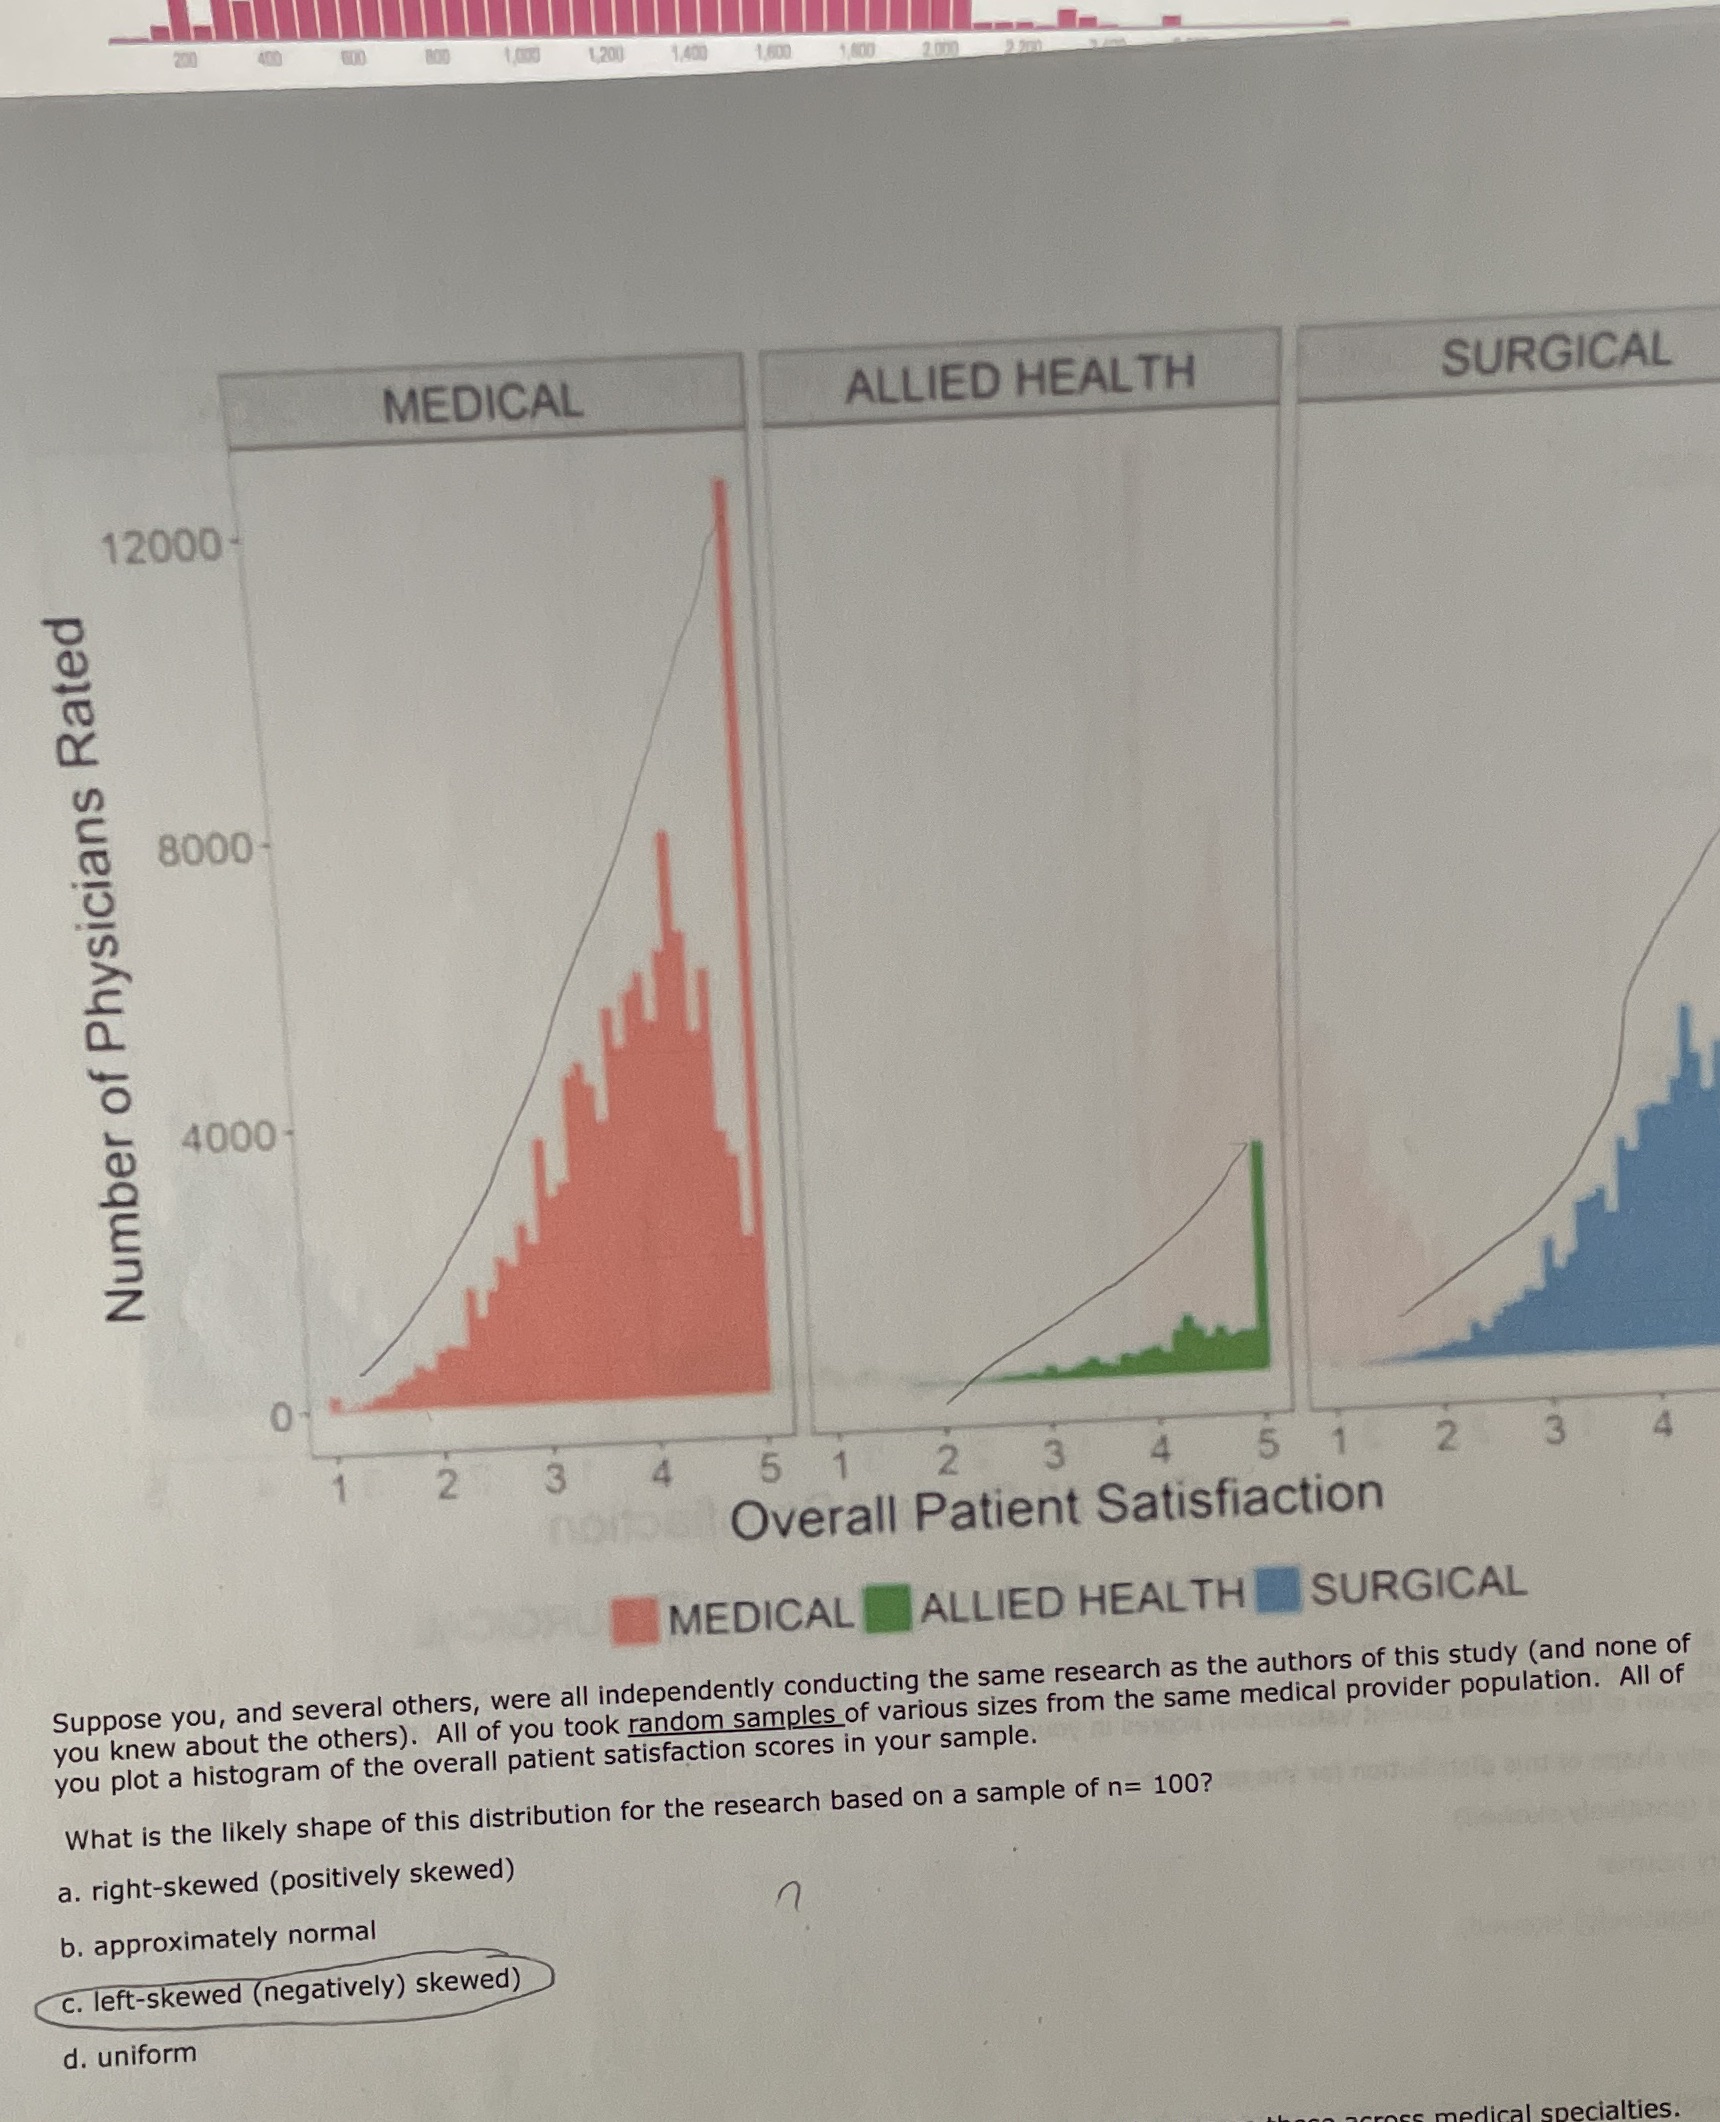
image text in transcribed
200 400 \\,200 1,400 1.600 2.000 MEDICAL ALLIED HEALTH SURGICAL 12000- 8000 Number of Physicians Rated 4000 2 3 5 1 2 3 4 5 1 2 3 norOverall Patient Satisfaction MEDICAL ALLIED HEALTH SURGICAL Suppose you, and several others, were all independently conducting the same research as the authors of this study (and none of you knew about the others). All of you took random samples of various sizes from the same medical provider population. All of you plot a histogram of the overall patient satisfaction scores in your sample. What is the likely shape of this distribution for the research based on a sample of n= 100? a. right-skewed (positively skewed) b. approximately normal c. left-skewed (negatively) skewed) d. uniform

Step by Step Solution

There are 3 Steps involved in it

Step: 1

blur-text-image

Get Instant Access to Expert-Tailored Solutions

See step-by-step solutions with expert insights and AI powered tools for academic success

Step: 2

blur-text-image_2

Step: 3

blur-text-image_3

Ace Your Homework with AI

Get the answers you need in no time with our AI-driven, step-by-step assistance

Get Started

Recommended Textbook for

Intermediate Algebra

Authors: Marvin L Bittinger

11th Edition

0321968395, 9780321968395

More Books

Students also viewed these Mathematics questions