

Answered step by step
Verified Expert Solution
Question
1 Approved Answer
if we cannot read your answer, you will not receive credit for it. Net Worth Statement (market value) Name: Twin Pines Farm Date: 12/31 Assets
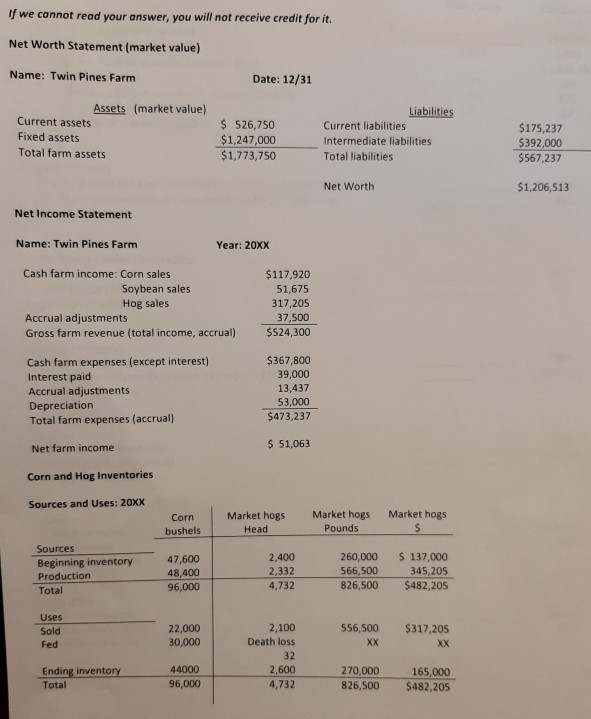
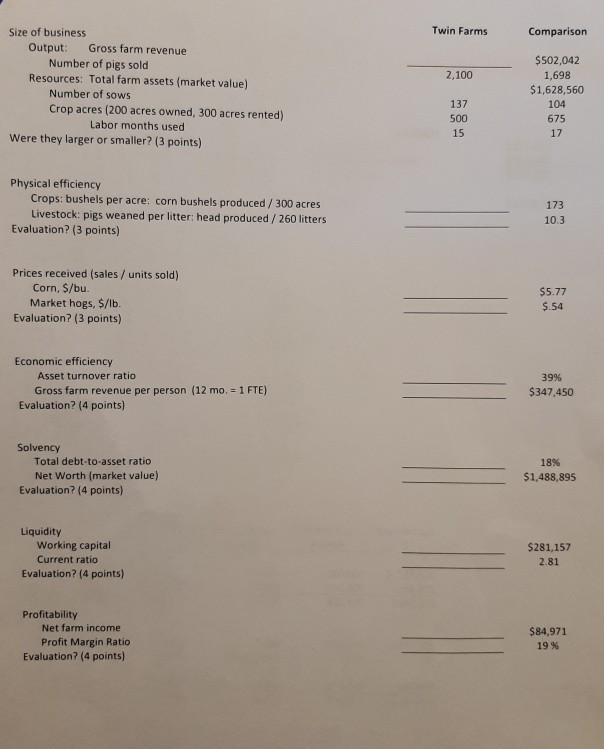
if we cannot read your answer, you will not receive credit for it. Net Worth Statement (market value) Name: Twin Pines Farm Date: 12/31 Assets (market value) Current assets Fixed assets Total farm assets $ 526,750 $1,247,000 $1,773,750 Liabilities Current liabilities Intermediate liabilities Total liabilities $175,237 $392,000 $567,237 Net Worth $1,206,513 Net Income Statement Name: Twin Pines Farm Year: 20xx Cash farm income: Corn sales Soybean sales Hog sales Accrual adjustments Gross farm revenue (total income, accrual) $117.920 51,675 317,205 37,500 $524,300 Cash farm expenses (except interest) Interest paid Accrual adjustments Depreciation Total farm expenses (accrual) $367,800 39,000 13,437 53,000 $473,237 Net farm income $ 51,063 Corn and Hog Inventories Sources and Uses: 20XX Market hogs Corn bushels Market hogs Head Market hogs Pounds Sources Beginning inventory Production Total 47,600 48,400 96,000 2,400 2,332 4,732 260,000 566,500 826,500 $137,000 345,205 $482,205 Uses Sold Fed 22,000 2,100 Death loss 556,500 XX 30,000 $317,205 XX 32 Ending inventory Total 44000 96,000 2,600 4,732 270,000 826,500 165,000 $482,205 Twin Farms Comparison 2,100 Size of business Output: Gross farm revenue Number of pigs sold Resources: Total farm assets (market value) Number of sows Crop acres (200 acres owned, 300 acres rented) Labor months used Were they larger or smaller? (3 points) $502,042 1,698 $1,628,560 137 104 500 675 17 Physical efficiency Crops: bushels per acre: corn bushels produced / 300 acres Livestock: pigs weaned per litter: head produced/260 litters Evaluation? (3 points) 173 10.3 Prices received (sales / units sold) Corn, S/bu. Market hogs, $/b. Evaluation? (3 points) $5.77 $.54 Economic efficiency Asset turnover ratio Gross farm revenue per person (12 mo. = 1 FTE) Evaluation? (4 points) 39% $347.450 Solvency Total debt-to-asset ratio Net Worth (market value) Evaluation? (4 points) 18% $1,488,895 Liquidity Working capital Current ratio Evaluation? (4 points) $281,157 2.81 Profitability Net farm income Profit Margin Ratio Evaluation? (4 points) $84,971 19% if we cannot read your answer, you will not receive credit for it. Net Worth Statement (market value) Name: Twin Pines Farm Date: 12/31 Assets (market value) Current assets Fixed assets Total farm assets $ 526,750 $1,247,000 $1,773,750 Liabilities Current liabilities Intermediate liabilities Total liabilities $175,237 $392,000 $567,237 Net Worth $1,206,513 Net Income Statement Name: Twin Pines Farm Year: 20xx Cash farm income: Corn sales Soybean sales Hog sales Accrual adjustments Gross farm revenue (total income, accrual) $117.920 51,675 317,205 37,500 $524,300 Cash farm expenses (except interest) Interest paid Accrual adjustments Depreciation Total farm expenses (accrual) $367,800 39,000 13,437 53,000 $473,237 Net farm income $ 51,063 Corn and Hog Inventories Sources and Uses: 20XX Market hogs Corn bushels Market hogs Head Market hogs Pounds Sources Beginning inventory Production Total 47,600 48,400 96,000 2,400 2,332 4,732 260,000 566,500 826,500 $137,000 345,205 $482,205 Uses Sold Fed 22,000 2,100 Death loss 556,500 XX 30,000 $317,205 XX 32 Ending inventory Total 44000 96,000 2,600 4,732 270,000 826,500 165,000 $482,205 Twin Farms Comparison 2,100 Size of business Output: Gross farm revenue Number of pigs sold Resources: Total farm assets (market value) Number of sows Crop acres (200 acres owned, 300 acres rented) Labor months used Were they larger or smaller? (3 points) $502,042 1,698 $1,628,560 137 104 500 675 17 Physical efficiency Crops: bushels per acre: corn bushels produced / 300 acres Livestock: pigs weaned per litter: head produced/260 litters Evaluation? (3 points) 173 10.3 Prices received (sales / units sold) Corn, S/bu. Market hogs, $/b. Evaluation? (3 points) $5.77 $.54 Economic efficiency Asset turnover ratio Gross farm revenue per person (12 mo. = 1 FTE) Evaluation? (4 points) 39% $347.450 Solvency Total debt-to-asset ratio Net Worth (market value) Evaluation? (4 points) 18% $1,488,895 Liquidity Working capital Current ratio Evaluation? (4 points) $281,157 2.81 Profitability Net farm income Profit Margin Ratio Evaluation? (4 points) $84,971 19%
Step by Step Solution
There are 3 Steps involved in it
Step: 1

Get Instant Access to Expert-Tailored Solutions
See step-by-step solutions with expert insights and AI powered tools for academic success
Step: 2

Step: 3
Ace Your Homework with AI
Get the answers you need in no time with our AI-driven, step-by-step assistance
Get Started
Advances In Quantitative Analysis Of Finance And Accounting (Vol. 5)
Authors: Lee Cheng Few
1st Edition
9812706283, 9789812706287