Answered step by step
Verified Expert Solution
Question
1 Approved Answer
Required: 5. Go to the tab titled Job Profitability.: a. Using formulas that refer to your answers from requirements 1-4, calculate the direct materials,

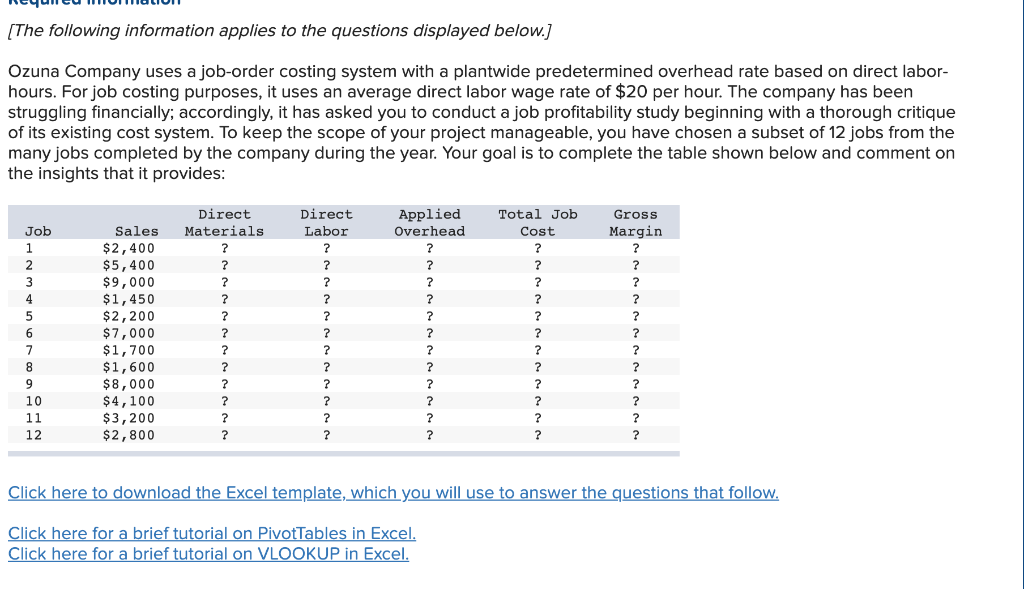
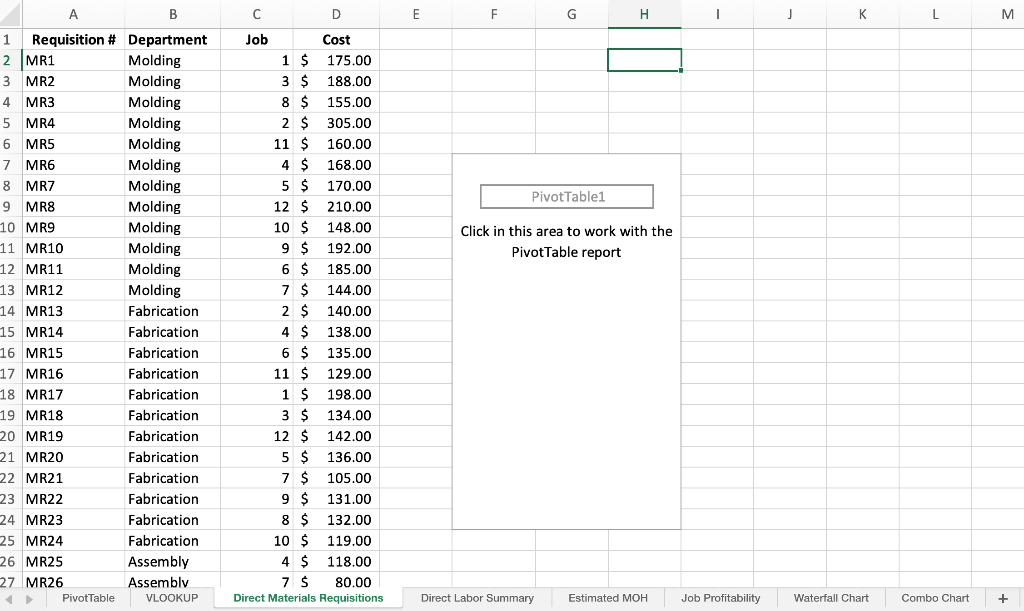
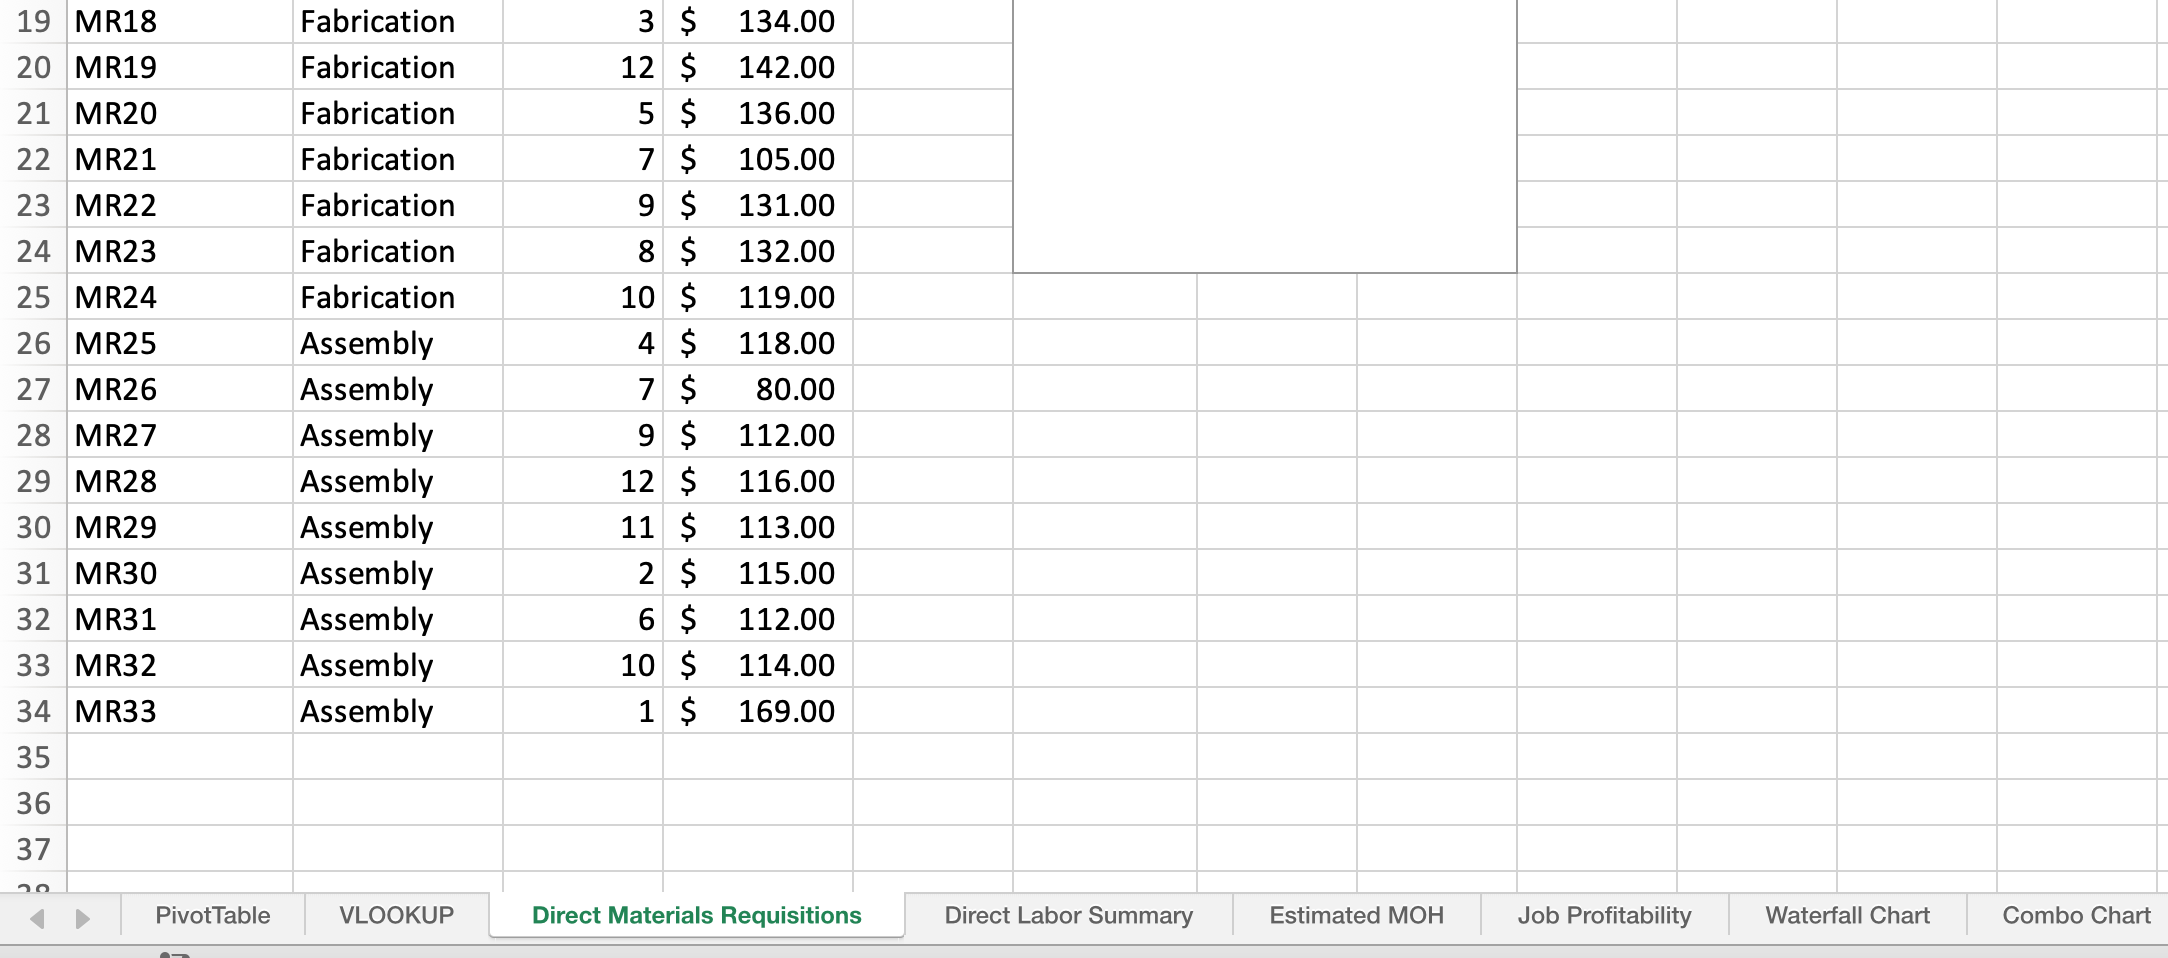
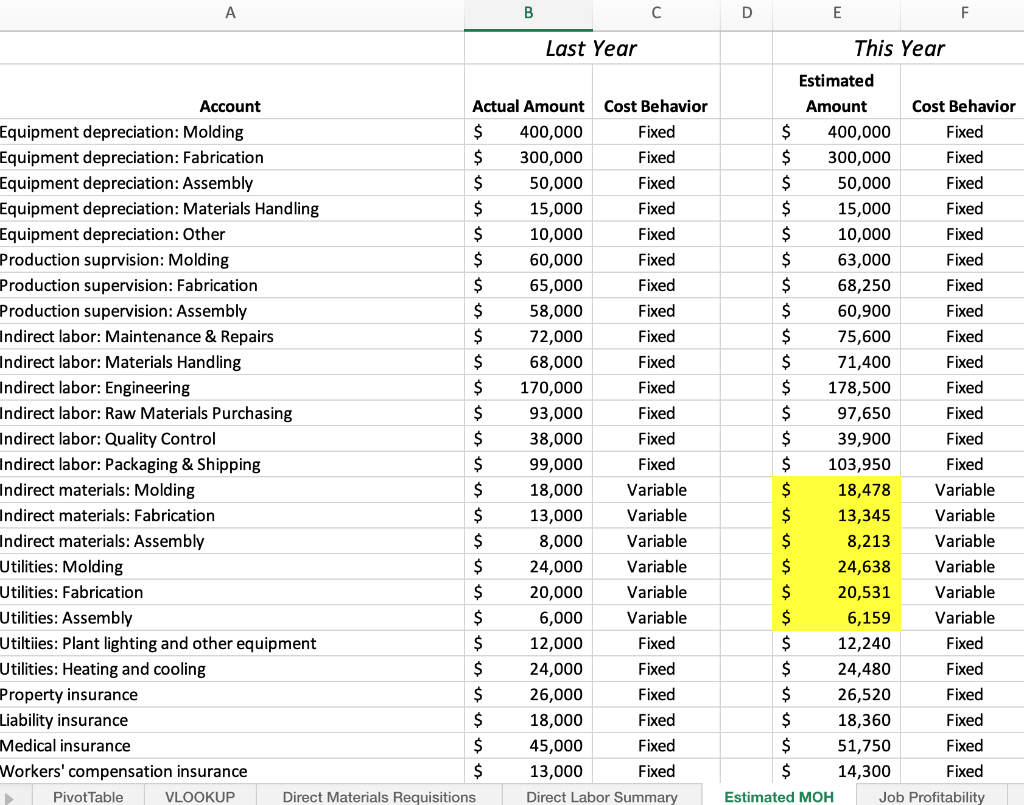
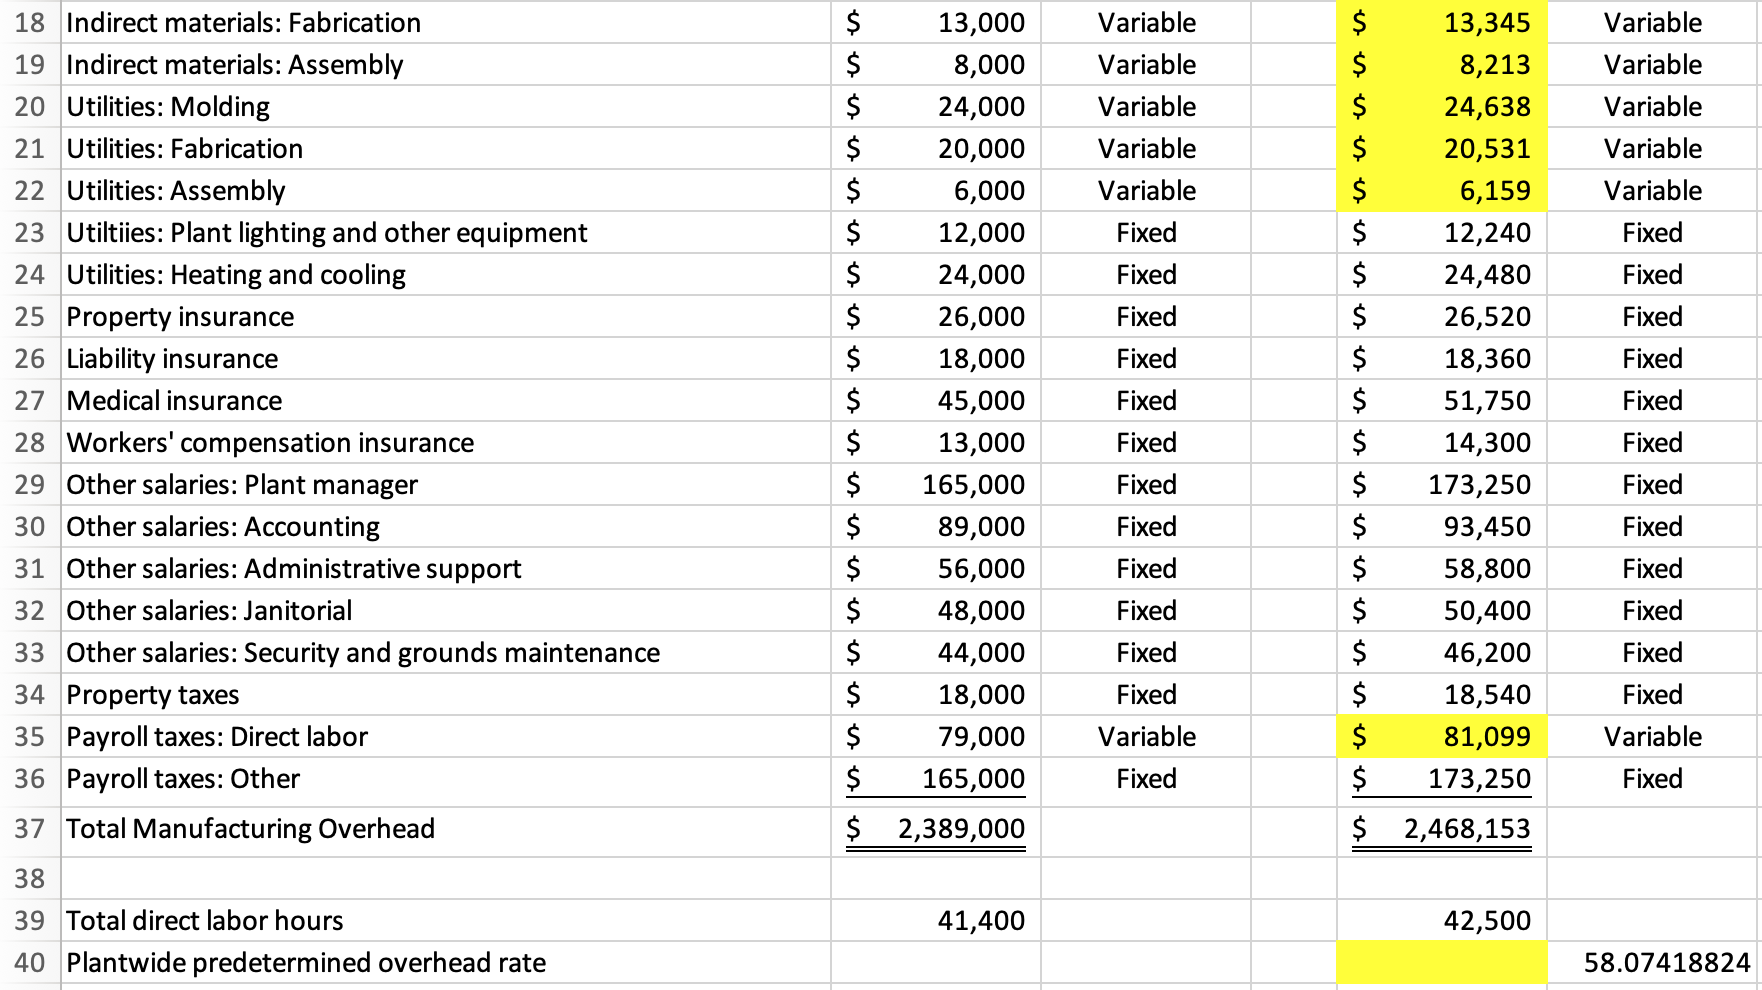
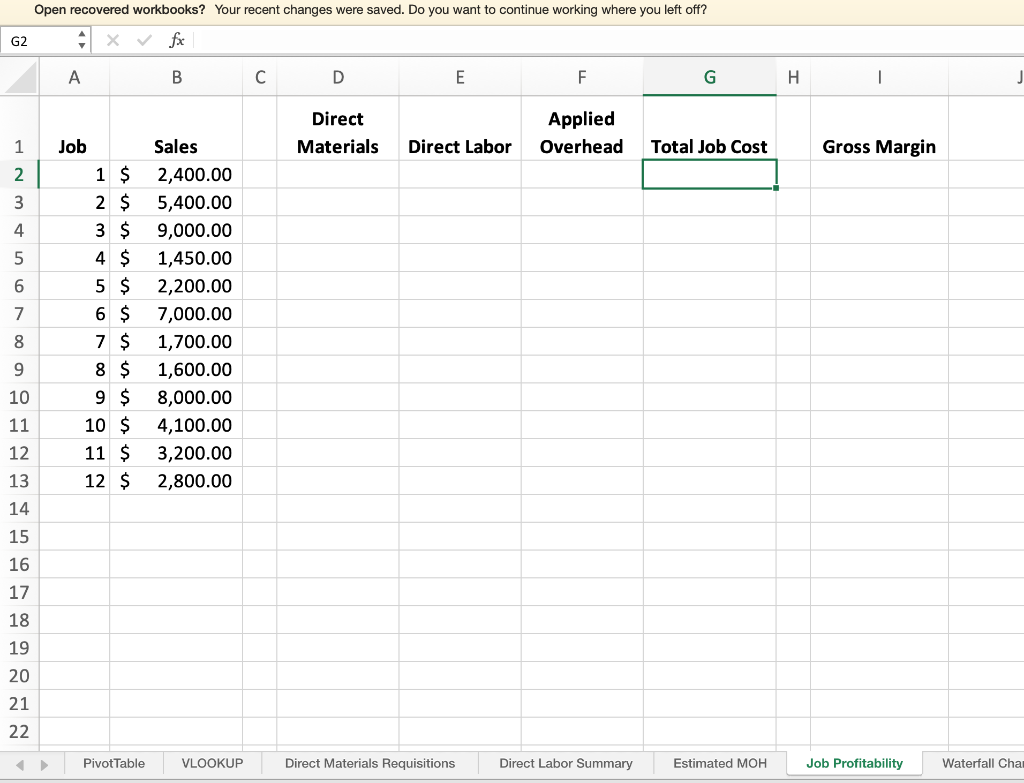
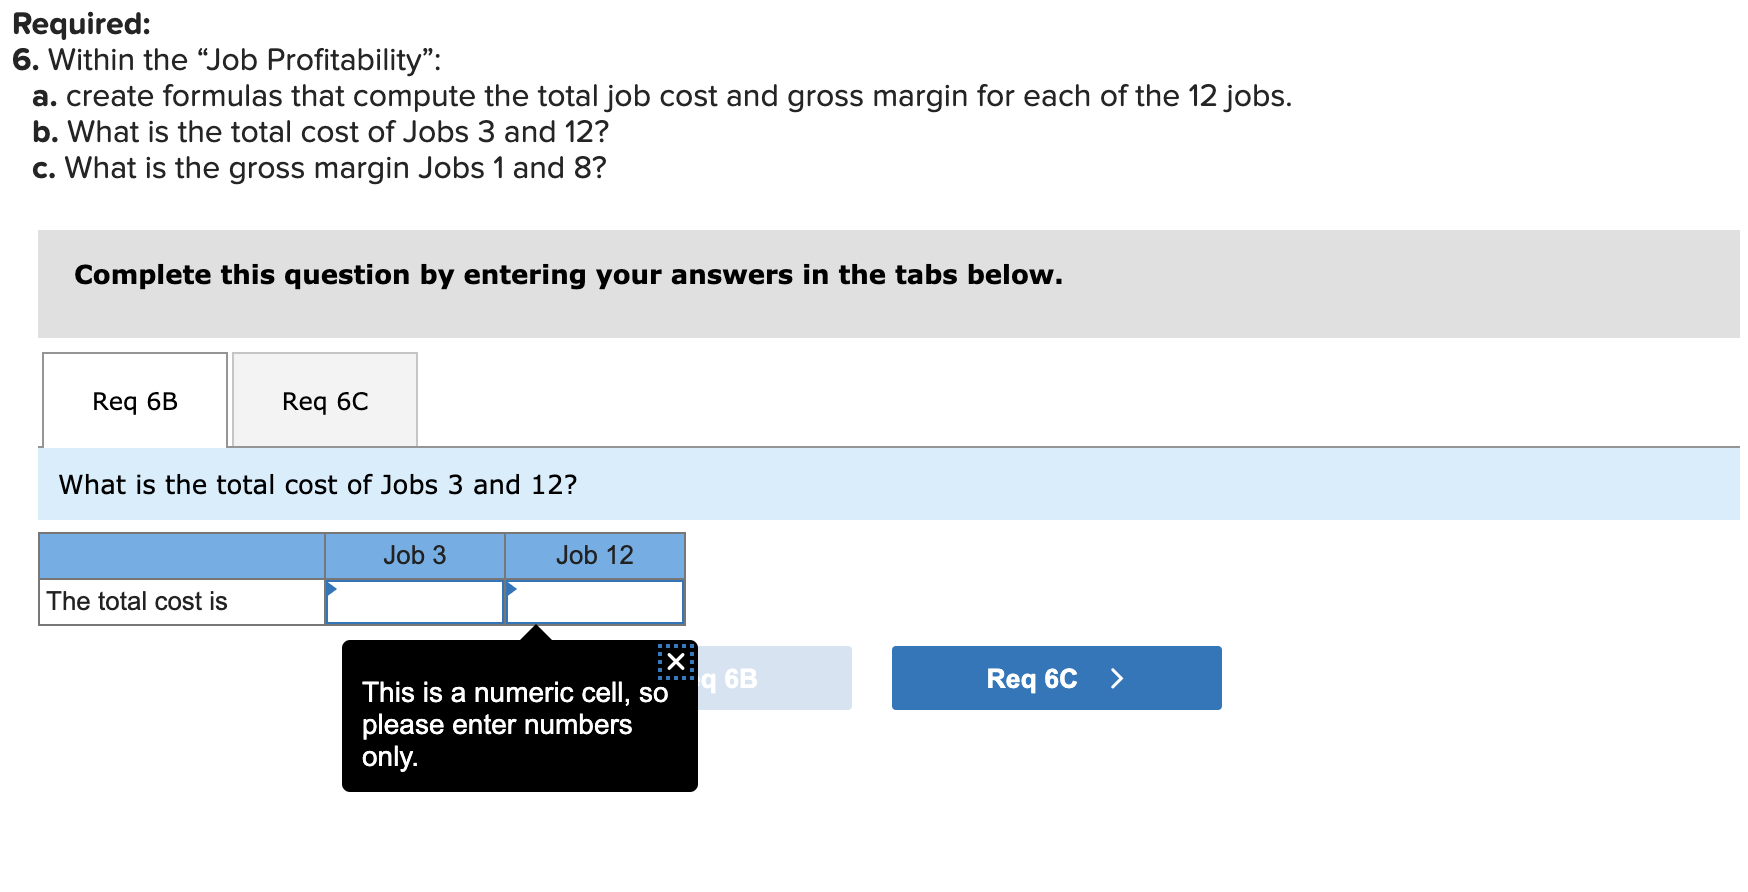
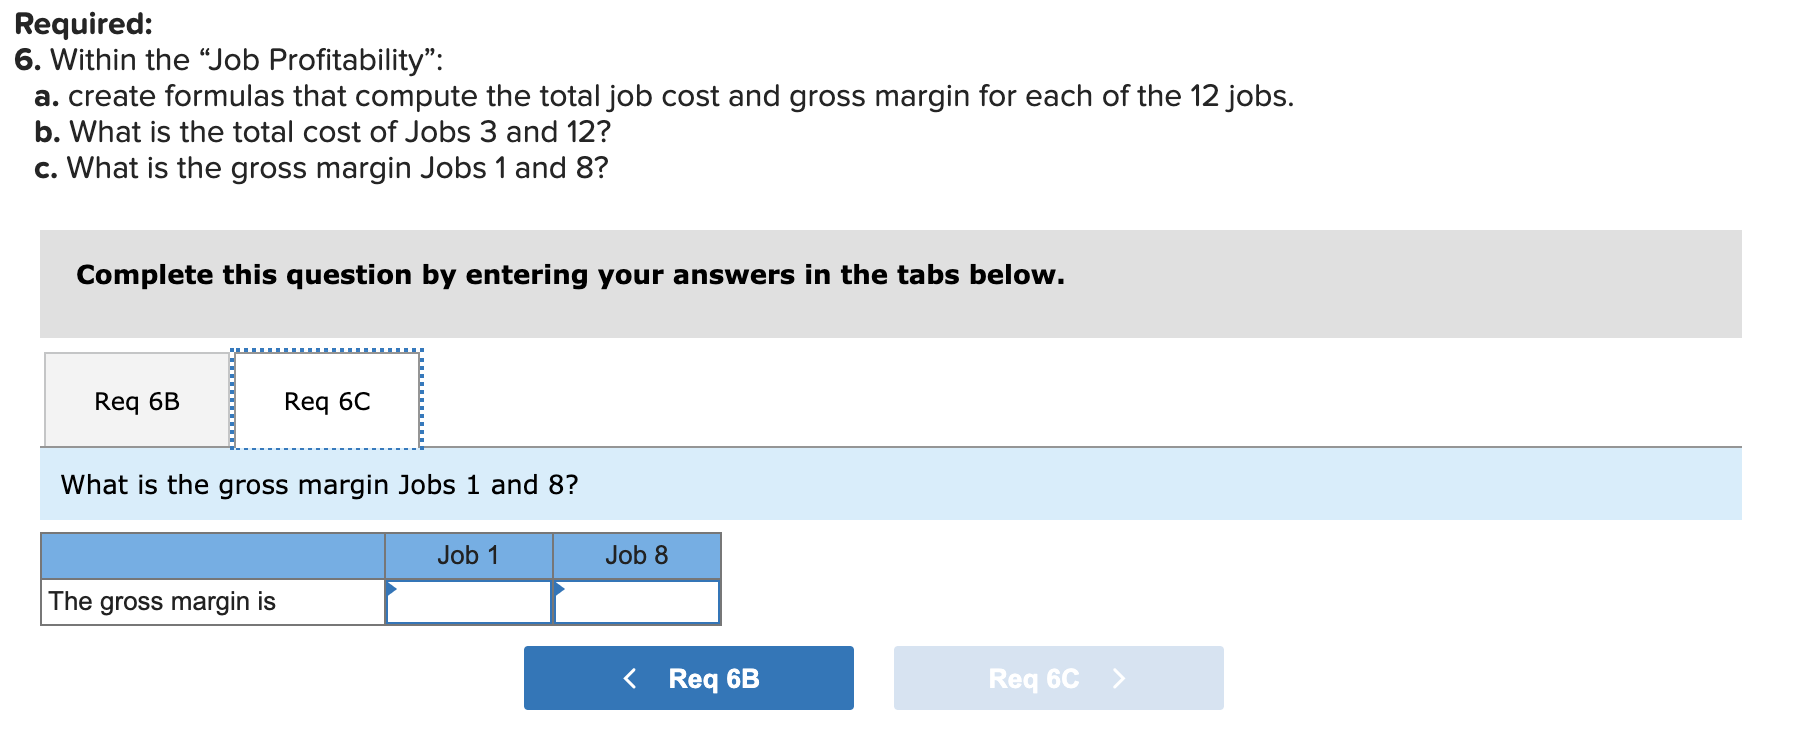
Required: 5. Go to the tab titled "Job Profitability.": a. Using formulas that refer to your answers from requirements 1-4, calculate the direct materials, direct labor, and applied overhead cost for each of the 12 jobs. (Hint: Use VLOOKUP to reference values from the pivot tables you created in requirements 1 and 2.) b. What is the amount of applied overhead for Jobs 4 and 9? Job 4 Job 9 The applied overhead is [The following information applies to the questions displayed below.] Ozuna Company uses a job-order costing system with a plantwide predetermined overhead rate based on direct labor- hours. For job costing purposes, it uses an average direct labor wage rate of $20 per hour. The company has been struggling financially; accordingly, it has asked you to conduct a job profitability study beginning with a thorough critique of its existing cost system. To keep the scope of your project manageable, you have chosen a subset of 12 jobs from the many jobs completed by the company during the year. Your goal is to complete the table shown below and comment on the insights that it provides: Job 1 Sales $2,400 Direct Materials Direct Labor ? ? Applied Overhead ? Total Job Cost Gross Margin ? ? 2 $5,400 ? ? ? ? ? 3 $9,000 ? ? ? ? ? 4 $1,450 ? ? ? ? ? $2,200 ? ? ? ? ? 6 $7,000 ? ? ? ? ? 7 $1,700 ? ? ? ? ? 8 $1,600 ? ? ? ? ? 9 $8,000 ? ? ? ? ? 10 $4,100 ? ? ? ? ? 11 $3,200 ? ? ? ? ? 12 $2,800 ? ? ? ? ? Click here to download the Excel template, which you will use to answer the questions that follow. Click here for a brief tutorial on PivotTables in Excel. Click here for a brief tutorial on VLOOKUP in Excel. A B C D E F G H K L M 1 Requisition # Department Job Cost 2 MR1 Molding 1 $ 175.00 3 MR2 Molding 3 $ 188.00 4 MR3 Molding 8 $ 155.00 5 MR4 Molding 2 $ 305.00 6 MR5 Molding 11 $ 160.00 7 MR6 Molding 4 $ 168.00 8 MR7 Molding 5 $ 170.00 PivotTable1 9 MR8 Molding 12 $ 210.00 10 MR9 Molding 10 11 MR10 Molding 9 $ $ 148.00 192.00 Click in this area to work with the PivotTable report 12 MR11 Molding 6 $ 185.00 13 MR12 Molding 7 $ 144.00 14 MR13 Fabrication 2 $ 140.00 15 MR14 Fabrication 4 $ 138.00 16 MR15 Fabrication 6 $ 135.00 17 MR16 Fabrication 11 $ 129.00 18 MR17 Fabrication 1 $ 198.00 19 MR18 Fabrication 3 $ 134.00 20 MR19 Fabrication 12 $ 142.00 21 MR20 Fabrication 5 $ 136.00 22 MR21 Fabrication 7 $ 105.00 23 MR22 Fabrication 9 $ 131.00 24 MR23 Fabrication 8 $ 132.00 25 MR24 Fabrication 10 $ 119.00 26 MR25 27 MR26 Assembly Assembly PivotTable VLOOKUP 4 $ 118.00 7 $ 80.00 Direct Materials Requisitions Direct Labor Summary Estimated MOH Job Profitability Waterfall Chart Combo Chart + 19 MR18 20 MR19 21 MR20 22 MR21 23 MR22 Fabrication Fabrication Fabrication Fabrication Fabrication 3 $ 134.00 12 $ 142.00 5 $ 136.00 7 $ 105.00 9 $ 131.00 24 MR23 Fabrication 8 $ 132.00 25 MR24 Fabrication 10 $ 119.00 26 MR25 Assembly 4 $ 118.00 27 MR26 Assembly 7 $ 80.00 28 MR27 Assembly 9 $ 112.00 29 MR28 Assembly 12 $ 116.00 30 MR29 Assembly 11 $ 113.00 31 MR30 Assembly 2 $ 115.00 32 MR31 Assembly 6 $ 112.00 33 MR32 Assembly 10 $ 114.00 34 MR33 Assembly 1 $ 169.00 35 36 37 20 PivotTable VLOOKUP Direct Materials Requisitions Direct Labor Summary Estimated MOH Job Profitability Waterfall Chart Combo Chart A D E F Last Year This Year Estimated Account Actual Amount Cost Behavior Amount Cost Behavior Equipment depreciation: Molding $ 400,000 Fixed $ 400,000 Fixed Equipment depreciation: Fabrication $ 300,000 Fixed $ 300,000 Fixed Equipment depreciation: Assembly $ 50,000 Fixed $ 50,000 Fixed Equipment depreciation: Materials Handling $ 15,000 Fixed $ 15,000 Fixed Equipment depreciation: Other $ 10,000 Fixed $ 10,000 Fixed Production suprvision: Molding $ 60,000 Fixed $ 63,000 Fixed Production supervision: Fabrication $ 65,000 Fixed $ 68,250 Fixed Production supervision: Assembly $ 58,000 Fixed $ 60,900 Fixed Indirect labor: Maintenance & Repairs $ 72,000 Fixed $ 75,600 Fixed Indirect labor: Materials Handling $ 68,000 Fixed $ 71,400 Fixed Indirect labor: Engineering $ 170,000 Fixed $ 178,500 Fixed Indirect labor: Raw Materials Purchasing $ 93,000 Fixed $ 97,650 Fixed Indirect labor: Quality Control $ 38,000 Fixed $ 39,900 Fixed Indirect labor: Packaging & Shipping $ 99,000 Fixed $ 103,950 Fixed Indirect materials: Molding $ 18,000 Variable $ 18,478 Variable Indirect materials: Fabrication $ 13,000 Variable $ 13,345 Variable Indirect materials: Assembly $ 8,000 Variable $ 8,213 Variable Utilities: Molding $ 24,000 Variable $ 24,638 Variable Utilities: Fabrication $ 20,000 Variable $ 20,531 Variable Utilities: Assembly $ 6,000 Variable $ 6,159 Variable Utilties: Plant lighting and other equipment $ 12,000 Fixed $ 12,240 Fixed Utilities: Heating and cooling $ 24,000 Fixed $ 24,480 Fixed Property insurance $ 26,000 Fixed $ 26,520 Fixed Liability insurance $ 18,000 Fixed $ 18,360 Fixed Medical insurance $ 45,000 Fixed $ 51,750 Fixed Workers' compensation insurance $ 13,000 Fixed $ 14,300 Fixed PivotTable VLOOKUP Direct Materials Requisitions Direct Labor Summary Estimated MOH Job Profitability 18 Indirect materials: Fabrication $ 13,000 Variable $ 13,345 Variable 19 Indirect materials: Assembly $ 8,000 Variable 8,213 Variable 20 Utilities: Molding $ 24,000 Variable $ 24,638 Variable 21 Utilities: Fabrication $ 20,000 Variable $ 20,531 Variable 22 Utilities: Assembly $ 6,000 Variable $ 6,159 Variable 23 Utilties: Plant lighting and other equipment $ 12,000 Fixed $ 12,240 Fixed 24 Utilities: Heating and cooling $ 24,000 Fixed $ 24,480 Fixed 25 Property insurance $ 26,000 Fixed $ 26,520 Fixed 26 Liability insurance 27 Medical insurance $ 18,000 Fixed $ 18,360 Fixed $ 45,000 Fixed $ 51,750 Fixed 28 Workers' compensation insurance $ 13,000 Fixed $ 14,300 Fixed 29 Other salaries: Plant manager $ 165,000 Fixed $ 173,250 Fixed 30 Other salaries: Accounting $ 89,000 Fixed $ 93,450 Fixed 31 Other salaries: Administrative support $ 56,000 Fixed $ 58,800 Fixed 32 Other salaries: Janitorial $ 48,000 Fixed $ 50,400 Fixed 33 Other salaries: Security and grounds maintenance $ 44,000 Fixed $ 46,200 Fixed 34 Property taxes $ 18,000 Fixed $ 18,540 Fixed 35 Payroll taxes: Direct labor $ 79,000 Variable $ 81,099 Variable 36 Payroll taxes: Other $ 165,000 Fixed $ 173,250 Fixed $ 2,389,000 $ 2,468,153 37 Total Manufacturing Overhead 38 39 Total direct labor hours 40 Plantwide predetermined overhead rate 41,400 42,500 58.07418824 G2 Open recovered workbooks? Your recent changes were saved. Do you want to continue working where you left off? fx J A B C D E F G H Direct 123456700 Job Sales Materials Direct Labor Applied Overhead Total Job Cost Gross Margin 1 $ 2,400.00 2 $ 5,400.00 3 $ 9,000.00 4 $ 1,450.00 5 $ 2,200.00 6 $ 7,000.00 8 7 $ 1,700.00 9 8 $ 1,600.00 3722 N = 10 9 $ 8,000.00 11 10 $4,100.00 12 11 $ 3,200.00 13 12 $ 2,800.00 14 15 16 17 18 19 22222 20 21 PivotTable VLOOKUP Direct Materials Requisitions Direct Labor Summary Estimated MOH Job Profitability Waterfall Char Required: 6. Within the "Job Profitability": a. create formulas that compute the total job cost and gross margin for each of the 12 jobs. b. What is the total cost of Jobs 3 and 12? c. What is the gross margin Jobs 1 and 8? Complete this question by entering your answers in the tabs below. Req 6B Req 6C What is the total cost of Jobs 3 and 12? The total cost is Job 3 Job 12 E 6B Req 6C > This is a numeric cell, so please enter numbers only. Required: 6. Within the "Job Profitability": a. create formulas that compute the total job cost and gross margin for each of the 12 jobs. b. What is the total cost of Jobs 3 and 12? c. What is the gross margin Jobs 1 and 8? Complete this question by entering your answers in the tabs below. Req 6B Req 6C What is the gross margin Jobs 1 and 8? The gross margin is Job 1 Job 8 < Req 6B Req 6C >
Step by Step Solution
There are 3 Steps involved in it
Step: 1
To solve the task in Excel follow these steps Requirement 5 Job Profitability a Calc...
Get Instant Access to Expert-Tailored Solutions
See step-by-step solutions with expert insights and AI powered tools for academic success
Step: 2

Step: 3

Ace Your Homework with AI
Get the answers you need in no time with our AI-driven, step-by-step assistance
Get Started


