

Question: If you do not have SPSS or don't know how to work the program, please don't accept this question. SPSS Tutorial 6: Parametric Hypothesis Testing
If you do not have SPSS or don't know how to work the program, please don't accept this question.
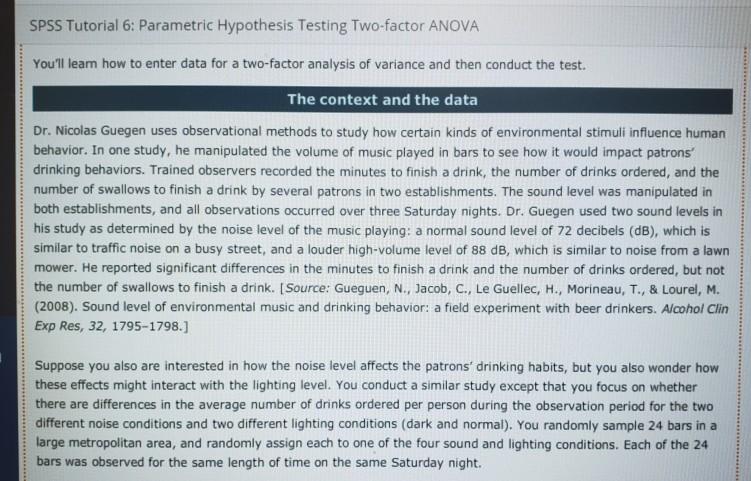
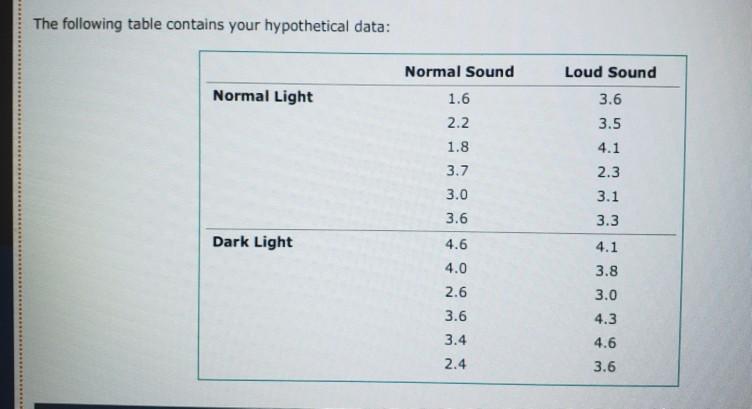
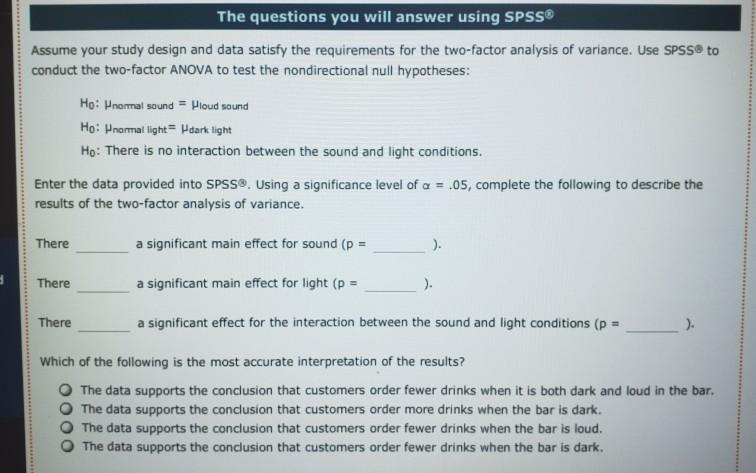
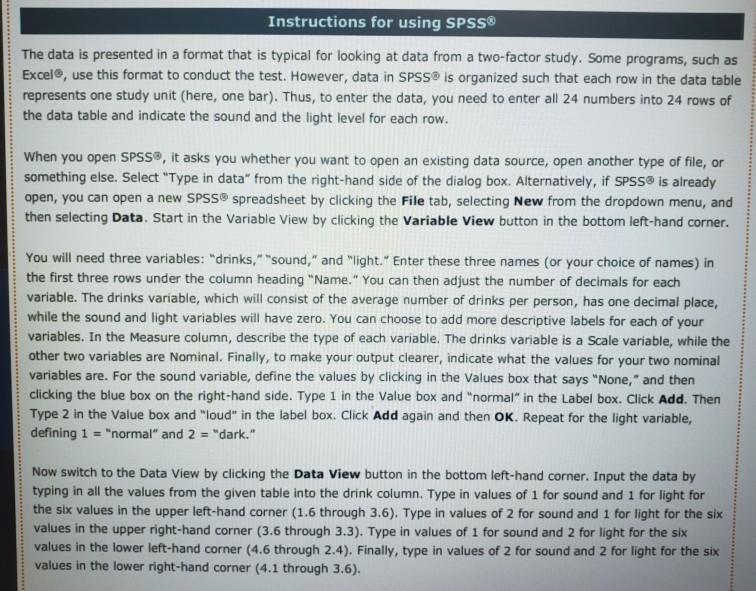
SPSS Tutorial 6: Parametric Hypothesis Testing Two-factor ANOVA You'll leam how to enter data for a two-factor analysis of variance and then conduct the test. The context and the data Dr. Nicolas Guegen uses observational methods to study how certain kinds of environmental stimuli influence human behavior. In one study, he manipulated the volume of music played in bars to see how it would impact patrons drinking behaviors. Trained observers recorded the minutes to finish a drink, the number of drinks ordered, and the number of swallows to finish a drink by several patrons in two establishments. The sound level was manipulated in both establishments, and all observations occurred over three Saturday nights. Dr. Guegen used two sound levels in his study as determined by the noise level of the music playing: a normal sound level of 72 decibels (dB), which is similar to traffic noise on a busy street, and a louder high-volume level of 88 dB, which is similar to noise from a lawn mower. He reported significant differences in the minutes to finish a drink and the number of drinks ordered, but not the number of swallows to finish a drink. (Source: Gueguen, N., Jacob, C., Le Guellec, H., Morineau, T., & Lourel, M. (2008). Sound level of environmental music and drinking behavior: a field experiment with beer drinkers. Alcohol Clin Exp Res, 32, 1795-1798.] Suppose you also are interested in how the noise level affects the patrons' drinking habits, but you also wonder how these effects might interact with the lighting level. You conduct a similar study except that you focus on whether there are differences in the average number of drinks ordered per person during the observation period for the two different noise conditions and two different lighting conditions (dark and normal). You randomly sample 24 bars in a large metropolitan area, and randomly assign each to one of the four sound and lighting conditions. Each of the 24 bars was observed for the same length of time on the same Saturday night. The following table contains your hypothetical data: Normal Sound Normal Light 1.6 2.2 1.8 Loud Sound 3.6 3.5 4.1 2.3 3.1 3.3 3.7 3.0 3.6 Dark Light 4.1 4.6 4.0 2.6 3.6 3.8 3.0 4.3 4.6 3.6 3.4 2.4 The questions you will answer using SPSS Assume your study design and data satisfy the requirements for the two-factor analysis of variance. Use SPSS to conduct the two-factor ANOVA to test the nondirectional null hypotheses: Ho: normal sound = Houd sound Ho: normal light = dark light Ho: There is no interaction between the sound and light conditions. Enter the data provided into SPSS. Using a significance level of a = .05, complete the following to describe the results of the two-factor analysis of variance. There a significant main effect for sound (p = ). 9 There a significant main effect for light (p = ). There a significant effect for the interaction between the sound and light conditions (p = ). Which of the following is the most accurate interpretation of the results? The data supports the conclusion that customers order fewer drinks when it is both dark and loud in the bar, The data supports the conclusion that customers order more drinks when the bar is dark. The data supports the conclusion that customers order fewer drinks when the bar is loud. The data supports the conclusion that customers order fewer drinks when the bar is dark. Instructions for using SPSS The data is presented in a format that is typical for looking at data from a two-factor study. Some programs, such as Excel, use this format to conduct the test. However, data in SPSS is organized such that each row in the data table represents one study unit (here, one bar). Thus, to enter the data, you need to enter all 24 numbers into 24 rows of the data table and indicate the sound and the light level for each row. When you open SPSS, it asks you whether you want to open an existing data source, open another type of file, or something else. Select "Type in data from the right-hand side of the dialog box. Alternatively, if SPSS is already open, you can open a new SPSS spreadsheet by clicking the File tab, selecting New from the dropdown menu, and then selecting Data. Start in the Variable View by clicking the Variable View button in the bottom left-hand corner. You will need three variables: "drinks," "sound," and "light." Enter these three names (or your choice of names) in the first three rows under the column heading "Name." You can then adjust the number of decimals for each variable. The drinks variable, which will consist of the average number of drinks per person, has one decimal place, while the sound and light variables will have zero. You can choose to add more descriptive labels for each of your variables. In the measure column, describe the type of each variable. The drinks variable is a Scale variable, while the other two variables are Nominal. Finally, to make your output clearer, indicate what the values for your two nominal variables are. For the sound variable, define the values by clicking in the values box that says "None," and then clicking the blue box on the right-hand side. Type 1 in the Value box and "normal" in the Label box. Click Add. Then Type 2 in the value box and "loud" in the label box. Click Add again and then OK. Repeat for the light variable, defining 1 = "normal" and 2 = "dark." Now switch to the Data View by clicking the Data View button in the bottom left-hand corner. Input the data by typing in all the values from the given table into the drink column. Type in values of 1 for sound and 1 for light for the six values in the upper left-hand corner (1.6 through 3.6). Type in values of 2 for sound and 1 for light for the six values in the upper right-hand corner (3.6 through 3.3). Type in values of 1 for sound and 2 for light for the six values in the lower left-hand corner (4.6 through 2.4). Finally, type in values of 2 for sound and 2 for light for the six values in the lower right-hand corner (4.1 through 3,6). That is all you need to do to obtain the ANOVA table for the two-factor ANOVA, but to interpret the results it also helps to ask for descriptive statistics and even a plot of the results. To do this, click Options and select "Descriptive statistics." Select the option "(OVERALL)" in the left-hand box and click the arrow to place it in the box labeled "Display Means for:. Click Continue. Then click Plots. Select "sound" and click the arrow to place it in the Horizontal Axis box, and then select "light" and click the arrow to place it in the "Separate Lines" box. Click Add, then Continue, and then OK. SPSS Tutorial 6: Parametric Hypothesis Testing Two-factor ANOVA You'll leam how to enter data for a two-factor analysis of variance and then conduct the test. The context and the data Dr. Nicolas Guegen uses observational methods to study how certain kinds of environmental stimuli influence human behavior. In one study, he manipulated the volume of music played in bars to see how it would impact patrons drinking behaviors. Trained observers recorded the minutes to finish a drink, the number of drinks ordered, and the number of swallows to finish a drink by several patrons in two establishments. The sound level was manipulated in both establishments, and all observations occurred over three Saturday nights. Dr. Guegen used two sound levels in his study as determined by the noise level of the music playing: a normal sound level of 72 decibels (dB), which is similar to traffic noise on a busy street, and a louder high-volume level of 88 dB, which is similar to noise from a lawn mower. He reported significant differences in the minutes to finish a drink and the number of drinks ordered, but not the number of swallows to finish a drink. (Source: Gueguen, N., Jacob, C., Le Guellec, H., Morineau, T., & Lourel, M. (2008). Sound level of environmental music and drinking behavior: a field experiment with beer drinkers. Alcohol Clin Exp Res, 32, 1795-1798.] Suppose you also are interested in how the noise level affects the patrons' drinking habits, but you also wonder how these effects might interact with the lighting level. You conduct a similar study except that you focus on whether there are differences in the average number of drinks ordered per person during the observation period for the two different noise conditions and two different lighting conditions (dark and normal). You randomly sample 24 bars in a large metropolitan area, and randomly assign each to one of the four sound and lighting conditions. Each of the 24 bars was observed for the same length of time on the same Saturday night. The following table contains your hypothetical data: Normal Sound Normal Light 1.6 2.2 1.8 Loud Sound 3.6 3.5 4.1 2.3 3.1 3.3 3.7 3.0 3.6 Dark Light 4.1 4.6 4.0 2.6 3.6 3.8 3.0 4.3 4.6 3.6 3.4 2.4 The questions you will answer using SPSS Assume your study design and data satisfy the requirements for the two-factor analysis of variance. Use SPSS to conduct the two-factor ANOVA to test the nondirectional null hypotheses: Ho: normal sound = Houd sound Ho: normal light = dark light Ho: There is no interaction between the sound and light conditions. Enter the data provided into SPSS. Using a significance level of a = .05, complete the following to describe the results of the two-factor analysis of variance. There a significant main effect for sound (p = ). 9 There a significant main effect for light (p = ). There a significant effect for the interaction between the sound and light conditions (p = ). Which of the following is the most accurate interpretation of the results? The data supports the conclusion that customers order fewer drinks when it is both dark and loud in the bar, The data supports the conclusion that customers order more drinks when the bar is dark. The data supports the conclusion that customers order fewer drinks when the bar is loud. The data supports the conclusion that customers order fewer drinks when the bar is dark. Instructions for using SPSS The data is presented in a format that is typical for looking at data from a two-factor study. Some programs, such as Excel, use this format to conduct the test. However, data in SPSS is organized such that each row in the data table represents one study unit (here, one bar). Thus, to enter the data, you need to enter all 24 numbers into 24 rows of the data table and indicate the sound and the light level for each row. When you open SPSS, it asks you whether you want to open an existing data source, open another type of file, or something else. Select "Type in data from the right-hand side of the dialog box. Alternatively, if SPSS is already open, you can open a new SPSS spreadsheet by clicking the File tab, selecting New from the dropdown menu, and then selecting Data. Start in the Variable View by clicking the Variable View button in the bottom left-hand corner. You will need three variables: "drinks," "sound," and "light." Enter these three names (or your choice of names) in the first three rows under the column heading "Name." You can then adjust the number of decimals for each variable. The drinks variable, which will consist of the average number of drinks per person, has one decimal place, while the sound and light variables will have zero. You can choose to add more descriptive labels for each of your variables. In the measure column, describe the type of each variable. The drinks variable is a Scale variable, while the other two variables are Nominal. Finally, to make your output clearer, indicate what the values for your two nominal variables are. For the sound variable, define the values by clicking in the values box that says "None," and then clicking the blue box on the right-hand side. Type 1 in the Value box and "normal" in the Label box. Click Add. Then Type 2 in the value box and "loud" in the label box. Click Add again and then OK. Repeat for the light variable, defining 1 = "normal" and 2 = "dark." Now switch to the Data View by clicking the Data View button in the bottom left-hand corner. Input the data by typing in all the values from the given table into the drink column. Type in values of 1 for sound and 1 for light for the six values in the upper left-hand corner (1.6 through 3.6). Type in values of 2 for sound and 1 for light for the six values in the upper right-hand corner (3.6 through 3.3). Type in values of 1 for sound and 2 for light for the six values in the lower left-hand corner (4.6 through 2.4). Finally, type in values of 2 for sound and 2 for light for the six values in the lower right-hand corner (4.1 through 3,6). That is all you need to do to obtain the ANOVA table for the two-factor ANOVA, but to interpret the results it also helps to ask for descriptive statistics and even a plot of the results. To do this, click Options and select "Descriptive statistics." Select the option "(OVERALL)" in the left-hand box and click the arrow to place it in the box labeled "Display Means for:. Click Continue. Then click Plots. Select "sound" and click the arrow to place it in the Horizontal Axis box, and then select "light" and click the arrow to place it in the "Separate Lines" box. Click Add, then Continue, and then OKStep by Step Solution
There are 3 Steps involved in it
1 Expert Approved Answer
Step: 1 Unlock

Question Has Been Solved by an Expert!
Get step-by-step solutions from verified subject matter experts
Step: 2 Unlock
Step: 3 Unlock