

Answered step by step
Verified Expert Solution
Question
1 Approved Answer
If you need anymore information, please specify in the comments. Data First Yearly Salaryi (S) Minimum 41,000 Baseline 55,902 Maximum 70,000 First month's rent ($)
If you need anymore information, please specify in the comments.
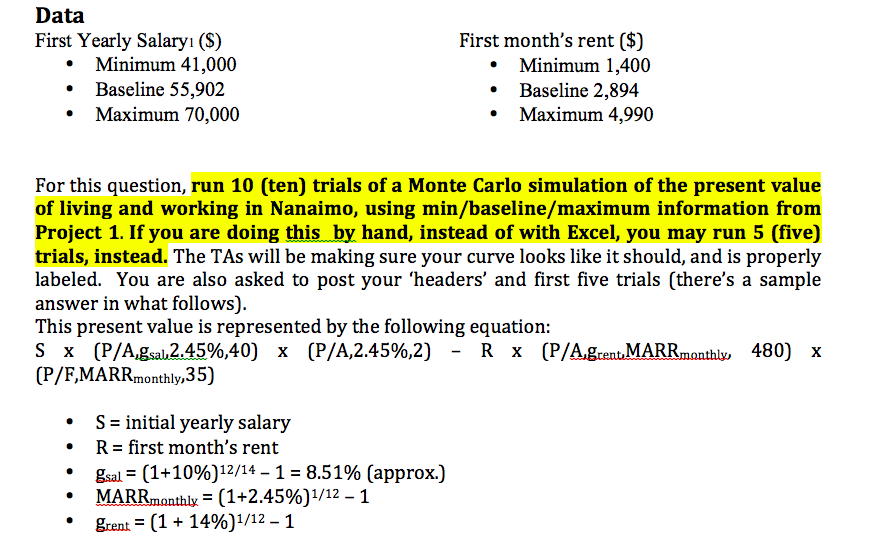
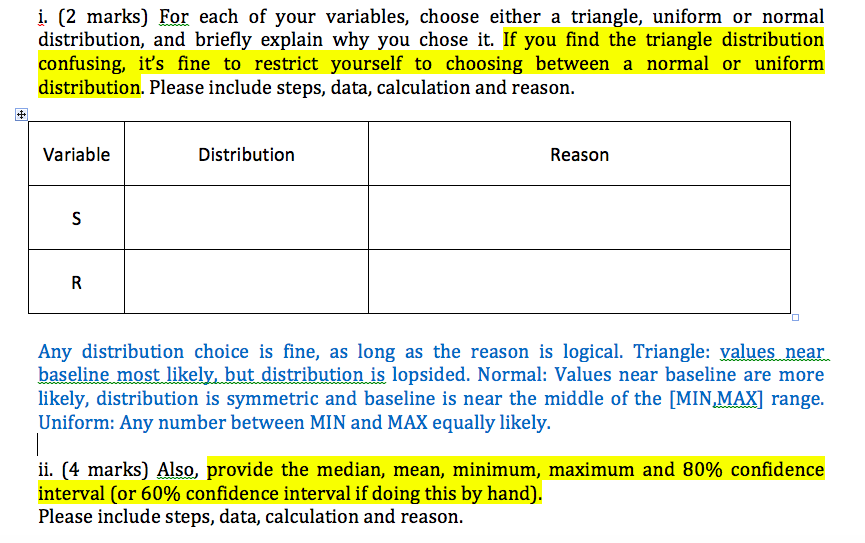
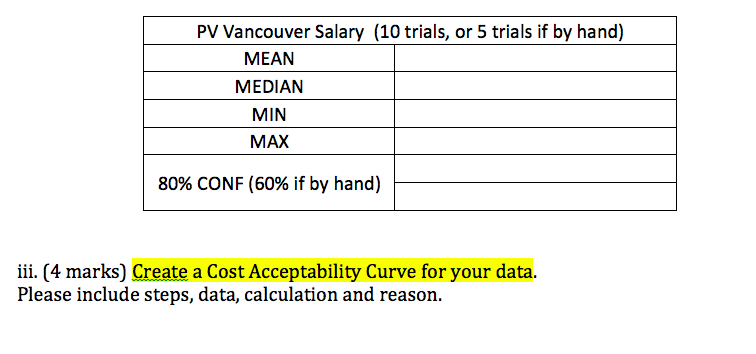
Data First Yearly Salaryi (S) Minimum 41,000 Baseline 55,902 Maximum 70,000 First month's rent ($) Minimum 1,400 Baseline 2,894 Maximum 4,990 For this question, run 10 (ten) trials of a Monte Carlo simulation of the present value of living and working in Nanaimo, using min/baseline/maximum information from Project 1. If you are doing this by hand, instead of with Excel, you may run 5 (five) trials, instead. The TAs will be making sure your curve looks like it should, and is properly labeled. You are also asked to post your 'headers' and first five trials (there's a sample answer in what follows). This present value is represented by the following equation: Sx (P/A,gsau2.45%,40) x (P/A,2.45%,2) - RX (P/A great.MARRmonthly 480) X (P/F,MARRmonthly,35) . S = initial yearly salary R = first month's rent gsal = (1+10%)12/14 - 1 = 8.51% (approx.) MARR monthly = (1+2.45%)1/12 - 1 grent = (1 + 14%)1/12 - 1 . . . i. (2 marks) For each of your variables, choose either a triangle, uniform or normal distribution, and briefly explain why you chose it. If you find the triangle distribution confusing, it's fine to restrict yourself to choosing between a normal or uniform distribution. Please include steps, data, calculation and reason. Variable Distribution Reason S R Any distribution choice is fine, as long as the reason is logical. Triangle: values near. baseline most likely, but distribution is lopsided. Normal: Values near baseline are more likely, distribution is symmetric and baseline is near the middle of the [MIN.MAX] range. Uniform: Any number between MIN and MAX equally likely. ii. (4 marks) Also, provide the median, mean, minimum, maximum and 80% confidence interval (or 60% confidence interval if doing this by hand). Please include steps, data, calculation and reason. PV Vancouver Salary (10 trials, or 5 trials if by hand) MEAN MEDIAN MIN MAX 80% CONF (60% if by hand) iii. (4 marks) Create a Cost Acceptability Curve for your data. Please include steps, data, calculation and reason. Data First Yearly Salaryi (S) Minimum 41,000 Baseline 55,902 Maximum 70,000 First month's rent ($) Minimum 1,400 Baseline 2,894 Maximum 4,990 For this question, run 10 (ten) trials of a Monte Carlo simulation of the present value of living and working in Nanaimo, using min/baseline/maximum information from Project 1. If you are doing this by hand, instead of with Excel, you may run 5 (five) trials, instead. The TAs will be making sure your curve looks like it should, and is properly labeled. You are also asked to post your 'headers' and first five trials (there's a sample answer in what follows). This present value is represented by the following equation: Sx (P/A,gsau2.45%,40) x (P/A,2.45%,2) - RX (P/A great.MARRmonthly 480) X (P/F,MARRmonthly,35) . S = initial yearly salary R = first month's rent gsal = (1+10%)12/14 - 1 = 8.51% (approx.) MARR monthly = (1+2.45%)1/12 - 1 grent = (1 + 14%)1/12 - 1 . . . i. (2 marks) For each of your variables, choose either a triangle, uniform or normal distribution, and briefly explain why you chose it. If you find the triangle distribution confusing, it's fine to restrict yourself to choosing between a normal or uniform distribution. Please include steps, data, calculation and reason. Variable Distribution Reason S R Any distribution choice is fine, as long as the reason is logical. Triangle: values near. baseline most likely, but distribution is lopsided. Normal: Values near baseline are more likely, distribution is symmetric and baseline is near the middle of the [MIN.MAX] range. Uniform: Any number between MIN and MAX equally likely. ii. (4 marks) Also, provide the median, mean, minimum, maximum and 80% confidence interval (or 60% confidence interval if doing this by hand). Please include steps, data, calculation and reason. PV Vancouver Salary (10 trials, or 5 trials if by hand) MEAN MEDIAN MIN MAX 80% CONF (60% if by hand) iii. (4 marks) Create a Cost Acceptability Curve for your data. Please include steps, data, calculation and reasonStep by Step Solution
There are 3 Steps involved in it
Step: 1

Get Instant Access to Expert-Tailored Solutions
See step-by-step solutions with expert insights and AI powered tools for academic success
Step: 2

Step: 3
Ace Your Homework with AI
Get the answers you need in no time with our AI-driven, step-by-step assistance
Get Started
Finanacial Investment Implemetation
Authors: Bill P. Hall
1st Edition
979-8359264228