 If your company holds these 4 positions for the whole period we analyze (2010/01/01-2013/02/01), Which month the total USD value of these 4 positions is highest. put your answer in format yyyymm (201101
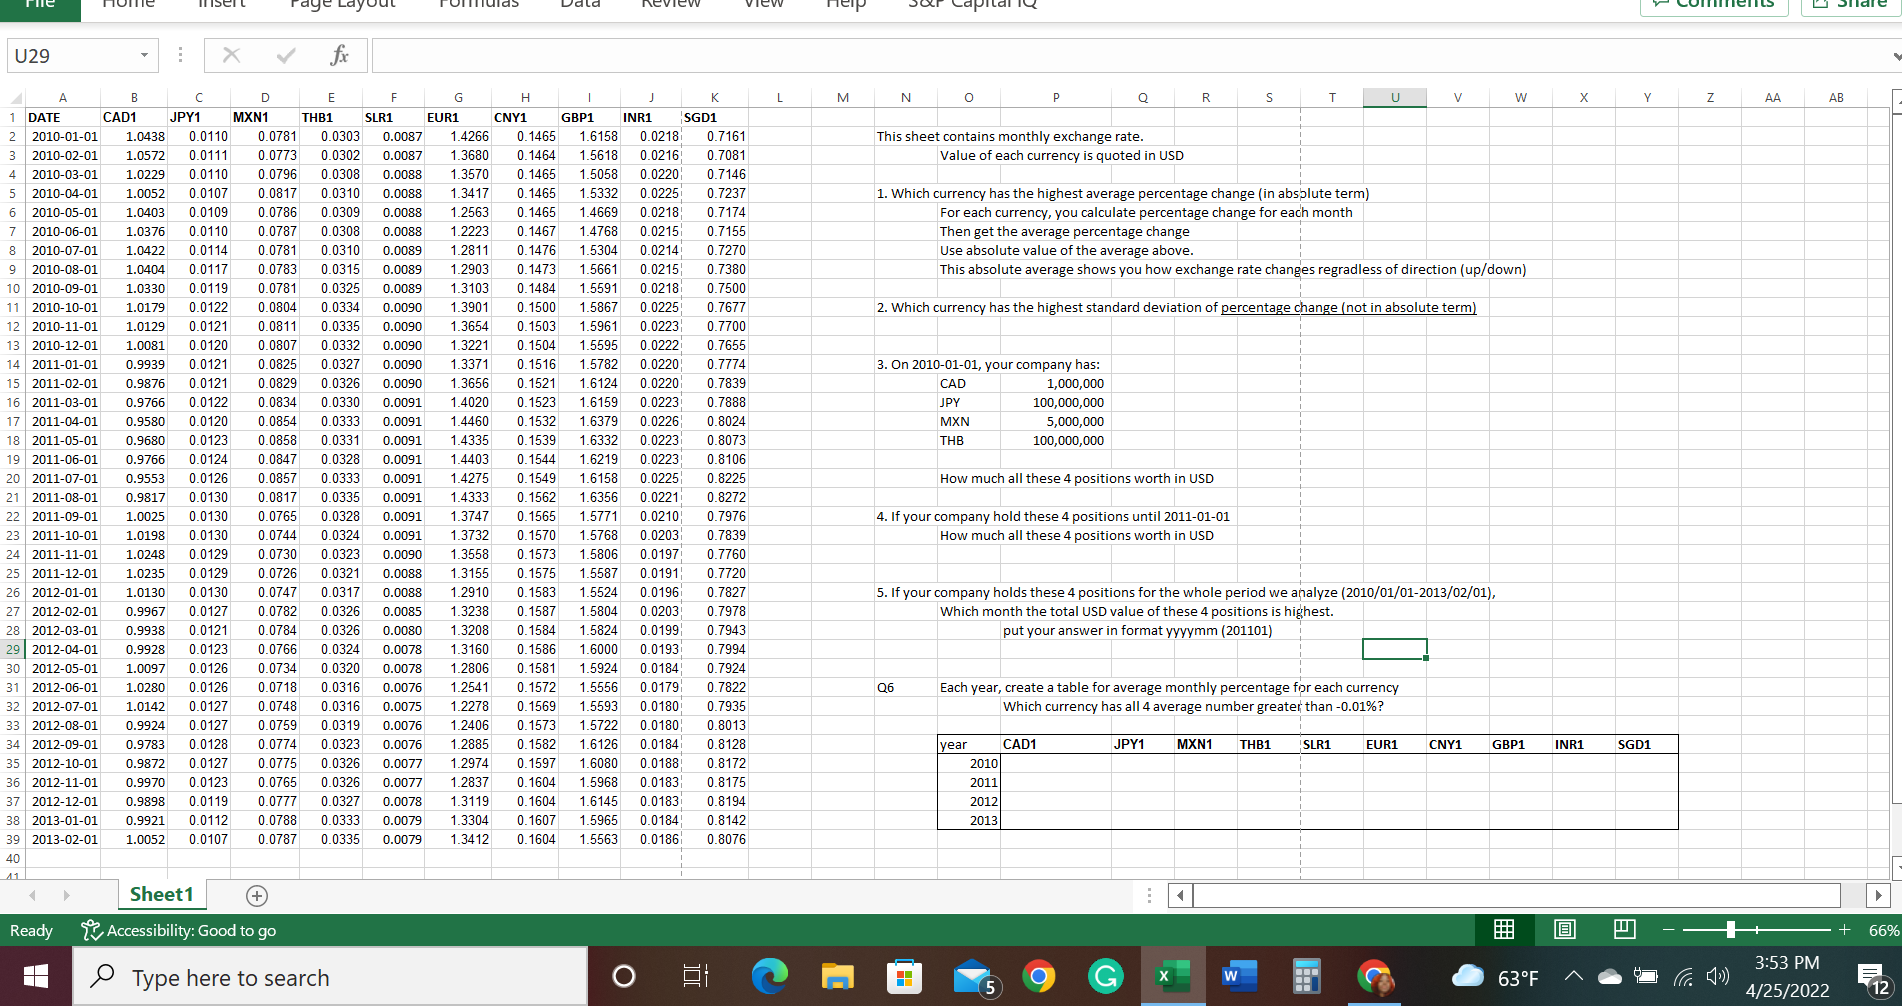
rie Dala X fx A B D E F G J K DATE EUR1 CAD1 JPY1 MXN1 2010-01-01 1.0438 0.0110 THB1 SLR1 0.0781 0.0303 0.0087 2 3 2010-02-01 1.0572 0.0111 0.0773 0.0302 0.0087 0.7161 0.7081 0.7146 4 2010-03-01 1.0229 0.0110 5 2010-04-01 6 2010-05-01 7 0.7237 0.7174 0.7155 0.7270 0.7380 H CNY1 GBP1 INR1 SGD1 1.4266 0.1465 1.6158 0.0218 1.3680 0.1464 1.5618 0.0216 0.0796 0.0308 0.0088 1.3570 0.1465 1.5058 0.0220 1.0052 0.0107 0.0817 0.0310 0.0088 1.3417 0.1465 1.5332 0.0225 1.0403 0.0109 0.0786 0.0309 0.0088 1.2563 0.1465 1.4669 0.0218 2010-06-01 1.0376 0.0110 0.0787 0.0308 0.0088 1.2223 0.1467 1.4768 0.0215 8 2010-07-01 1.0422 0.0114 0.0781 0.0310 0.0089 1.2811 0.1476 1.5304 0.0214 9 2010-08-01 1.0404 0.0117 0.0783 0.0315 0.0089 1.2903 0.1473 1.5661 0.0215 10 2010-09-01 1.0330 0.0119 0.0781 0.0325 0.0089 1.3103 0.1484 1.5591 0.0218 0.7500 11 2010-10-01 1.0179 0.0122 0.0804 0.0334 0.0090 1.3901 0.1500 1.5867 0.0225 0.7677 12 2010-11-01 1.0129 0.0121 0.0811 0.0335 0.0090 1.3654 0.1503 1.5961 0.0223 0.7700 13 2010-12-01 1.0081 0.0120 0.0807 0.0332 0.0090 1.3221 0.1504 1.5595 0.0222 0.7655 14 2011-01-01 0.9939 0.0121 0.0825 0.0327 0.0090 1.3371 0.1516 1.5782 0.0220 0.7774 15 2011-02-01 0.9876 0.0121 0.0829 0.0326 0.0090 1.3656 0.1521 1.6124 0.0220 0.7839 16 2011-03-01 0.9766 0.0122 0.0834 0.0330 0.0091 1.4020 0.1523 1.6159 0.0223 0.7888 17 2011-04-01 0.9580 0.0120 0.0854 0.0333 0.0091 1.4460 0.1532 1.6379 0.0226 0.8024 18 2011-05-01 0.9680 0.0123 0.0858 0.0331 0.0091 1.4335 0.1539 1.6332 0.0223 0.8073 19 2011-06-01 0.9766 0.0124 0.0847 0.0328 0.0091 1.4403 0.1544 1.6219 0.0223 0.8106 20 2011-07-01 0.9553 0.0126 0.0857 0.0333 0.0091 1.4275 0.1549 1.6158 0.0225 0.8225 2011-08-01 0.9817 0.0130 0.0817 0.0335 0.0091 1.4333 0.1562 1.6356 0.0221 0.8272 2011-09-01 1.0025 0.0130 0.0765 0.0328 0.0091 1.3747 0.1565 1.5771 0.0210 0.7976 23 2011-10-01 1.0198 0.0130 0.0744 0.0324 0.0091 1.3732 0.1570 1.5768 0.0203 0.7839 24 2011-11-01 1.0248 0.0129 0.0730 0.0323 0.0090 1.3558 0.1573 1.5806 0.0197 0.7760 25 2011-12-01 1.0235 0.0129 0.0726 0.0321 0.0088 1.3155 0.1575 1.5587 0.0191 0.7720 26 2012-01-01 1.0130 0.0130 0.0747 0.0317 0.0088 1.2910 0.1583 1.5524 0.0196 0.7827 27 2012-02-01 0.9967 0.0127 0.0782 0.0326 0.0085 1.3238 0.1587 1.5804 0.0203 0.7978 28 2012-03-01 0.9938 0.0121 0.0784 0.0326 0.0080 1.3208 0.1584 1.5824 0.0199 0.7943 29 2012-04-01 0.9928 0.0123 0.0766 0.0324 0.0078 1.3160 0.1586 1.6000 0.0193 0.7994 30 2012-05-01 1.0097 0.0126 0.0734 0.0320 0.0078 1.2806 0.1581 1.5924 0.0184 0.7924 31 2012-06-01 1.0280 0.0126 0.0718 0.0316 0.0076 1.2541 0.1572 1.5556 0.0179 0.7822 32 2012-07-01 1.0142 0.0127 0.0748 0.0316 0.0075 1.2278 0.1569 1.5593 0.0180 0.7935 33 2012-08-01 0.9924 0.0127 0.0759 0.0319 0.0076 1.2406 0.1573 1.5722 0.0180 0.8013 34 2012-09-01 0.9783 0.0128 0.0774 0.0323 0.0076 1.2885 0.1582 1.6126 0.0184 0.8128 35 2012-10-01 0.9872 0.0127 0.0775 0.0326 0.0077 1.2974 0.1597 1.6080 0.0188 0.8172 36 2012-11-01 0.9970 0.0123 0.0765 0.0326 0.0077 1.2837 0.1604 1.5968 0.0183 0.8175 37 2012-12-01 0.9898 0.0119 0.0777 0.0327 0.0078 1.3119 0.1604 1.6145 0.0183 0.8194 38 2013-01-01 0.9921 0.0112 0.0788 0.0333 0.0079 1.3304 0.1607 1.5965 0.0184 0.8142 39 2013-02-01 1.0052 0.0107 0.0787 0.0335 0.0079 1.3412 0.1604 1.5563 0.0186 0.8076 21 22 40 Sheet1 Ready Accessibility: Good to go U29 View Type here to search L M N O P O S U V W This sheet contains monthly exchange rate. Value of each currency is quoted in USD 1. Which currency has the highest average percentage change (in absolute term) For each currency, you calculate percentage change for each month Then get the average percentage change Use absolute value of the average above. This absolute average shows you how exchange rate changes regradless of direction (up/down) 2. Which currency has the highest standard deviation of percentage change (not in absolute term) 3. On 2010-01-01, your company has: CAD JPY 1,000,000 100,000,000 5,000,000 100,000,000 MXN THB How much all these 4 positions worth in USD 4. If your company hold these 4 positions until 2011-01-01 How much all these 4 positions worth in USD 5. If your company holds these 4 positions for the whole period we analyze (2010/01/01-2013/02/01), Which month the total USD value of these 4 positions is highest. put your answer in format yyyymm (201101) Q6 Each year, create a table for average monthly percentage for each currency Which currency has all 4 average number greater than -0.01%? year CAD1 JPY1 MXN1 THB1 SLR1 EUR1 GBP1 H 2010 2011 2012 2013 R W CNY1 63F Xx INR1 B Y SGD1 E Z AA AB 3:53 PM 4/25/2022 66% E 12 rie Dala X fx A B D E F G J K DATE EUR1 CAD1 JPY1 MXN1 2010-01-01 1.0438 0.0110 THB1 SLR1 0.0781 0.0303 0.0087 2 3 2010-02-01 1.0572 0.0111 0.0773 0.0302 0.0087 0.7161 0.7081 0.7146 4 2010-03-01 1.0229 0.0110 5 2010-04-01 6 2010-05-01 7 0.7237 0.7174 0.7155 0.7270 0.7380 H CNY1 GBP1 INR1 SGD1 1.4266 0.1465 1.6158 0.0218 1.3680 0.1464 1.5618 0.0216 0.0796 0.0308 0.0088 1.3570 0.1465 1.5058 0.0220 1.0052 0.0107 0.0817 0.0310 0.0088 1.3417 0.1465 1.5332 0.0225 1.0403 0.0109 0.0786 0.0309 0.0088 1.2563 0.1465 1.4669 0.0218 2010-06-01 1.0376 0.0110 0.0787 0.0308 0.0088 1.2223 0.1467 1.4768 0.0215 8 2010-07-01 1.0422 0.0114 0.0781 0.0310 0.0089 1.2811 0.1476 1.5304 0.0214 9 2010-08-01 1.0404 0.0117 0.0783 0.0315 0.0089 1.2903 0.1473 1.5661 0.0215 10 2010-09-01 1.0330 0.0119 0.0781 0.0325 0.0089 1.3103 0.1484 1.5591 0.0218 0.7500 11 2010-10-01 1.0179 0.0122 0.0804 0.0334 0.0090 1.3901 0.1500 1.5867 0.0225 0.7677 12 2010-11-01 1.0129 0.0121 0.0811 0.0335 0.0090 1.3654 0.1503 1.5961 0.0223 0.7700 13 2010-12-01 1.0081 0.0120 0.0807 0.0332 0.0090 1.3221 0.1504 1.5595 0.0222 0.7655 14 2011-01-01 0.9939 0.0121 0.0825 0.0327 0.0090 1.3371 0.1516 1.5782 0.0220 0.7774 15 2011-02-01 0.9876 0.0121 0.0829 0.0326 0.0090 1.3656 0.1521 1.6124 0.0220 0.7839 16 2011-03-01 0.9766 0.0122 0.0834 0.0330 0.0091 1.4020 0.1523 1.6159 0.0223 0.7888 17 2011-04-01 0.9580 0.0120 0.0854 0.0333 0.0091 1.4460 0.1532 1.6379 0.0226 0.8024 18 2011-05-01 0.9680 0.0123 0.0858 0.0331 0.0091 1.4335 0.1539 1.6332 0.0223 0.8073 19 2011-06-01 0.9766 0.0124 0.0847 0.0328 0.0091 1.4403 0.1544 1.6219 0.0223 0.8106 20 2011-07-01 0.9553 0.0126 0.0857 0.0333 0.0091 1.4275 0.1549 1.6158 0.0225 0.8225 2011-08-01 0.9817 0.0130 0.0817 0.0335 0.0091 1.4333 0.1562 1.6356 0.0221 0.8272 2011-09-01 1.0025 0.0130 0.0765 0.0328 0.0091 1.3747 0.1565 1.5771 0.0210 0.7976 23 2011-10-01 1.0198 0.0130 0.0744 0.0324 0.0091 1.3732 0.1570 1.5768 0.0203 0.7839 24 2011-11-01 1.0248 0.0129 0.0730 0.0323 0.0090 1.3558 0.1573 1.5806 0.0197 0.7760 25 2011-12-01 1.0235 0.0129 0.0726 0.0321 0.0088 1.3155 0.1575 1.5587 0.0191 0.7720 26 2012-01-01 1.0130 0.0130 0.0747 0.0317 0.0088 1.2910 0.1583 1.5524 0.0196 0.7827 27 2012-02-01 0.9967 0.0127 0.0782 0.0326 0.0085 1.3238 0.1587 1.5804 0.0203 0.7978 28 2012-03-01 0.9938 0.0121 0.0784 0.0326 0.0080 1.3208 0.1584 1.5824 0.0199 0.7943 29 2012-04-01 0.9928 0.0123 0.0766 0.0324 0.0078 1.3160 0.1586 1.6000 0.0193 0.7994 30 2012-05-01 1.0097 0.0126 0.0734 0.0320 0.0078 1.2806 0.1581 1.5924 0.0184 0.7924 31 2012-06-01 1.0280 0.0126 0.0718 0.0316 0.0076 1.2541 0.1572 1.5556 0.0179 0.7822 32 2012-07-01 1.0142 0.0127 0.0748 0.0316 0.0075 1.2278 0.1569 1.5593 0.0180 0.7935 33 2012-08-01 0.9924 0.0127 0.0759 0.0319 0.0076 1.2406 0.1573 1.5722 0.0180 0.8013 34 2012-09-01 0.9783 0.0128 0.0774 0.0323 0.0076 1.2885 0.1582 1.6126 0.0184 0.8128 35 2012-10-01 0.9872 0.0127 0.0775 0.0326 0.0077 1.2974 0.1597 1.6080 0.0188 0.8172 36 2012-11-01 0.9970 0.0123 0.0765 0.0326 0.0077 1.2837 0.1604 1.5968 0.0183 0.8175 37 2012-12-01 0.9898 0.0119 0.0777 0.0327 0.0078 1.3119 0.1604 1.6145 0.0183 0.8194 38 2013-01-01 0.9921 0.0112 0.0788 0.0333 0.0079 1.3304 0.1607 1.5965 0.0184 0.8142 39 2013-02-01 1.0052 0.0107 0.0787 0.0335 0.0079 1.3412 0.1604 1.5563 0.0186 0.8076 21 22 40 Sheet1 Ready Accessibility: Good to go U29 View Type here to search L M N O P O S U V W This sheet contains monthly exchange rate. Value of each currency is quoted in USD 1. Which currency has the highest average percentage change (in absolute term) For each currency, you calculate percentage change for each month Then get the average percentage change Use absolute value of the average above. This absolute average shows you how exchange rate changes regradless of direction (up/down) 2. Which currency has the highest standard deviation of percentage change (not in absolute term) 3. On 2010-01-01, your company has: CAD JPY 1,000,000 100,000,000 5,000,000 100,000,000 MXN THB How much all these 4 positions worth in USD 4. If your company hold these 4 positions until 2011-01-01 How much all these 4 positions worth in USD 5. If your company holds these 4 positions for the whole period we analyze (2010/01/01-2013/02/01), Which month the total USD value of these 4 positions is highest. put your answer in format yyyymm (201101) Q6 Each year, create a table for average monthly percentage for each currency Which currency has all 4 average number greater than -0.01%? year CAD1 JPY1 MXN1 THB1 SLR1 EUR1 GBP1 H 2010 2011 2012 2013 R W CNY1 63F Xx INR1 B Y SGD1 E Z AA AB 3:53 PM 4/25/2022 66% E 12