 Ignore the switch navigator and driver. USE R STUDIO
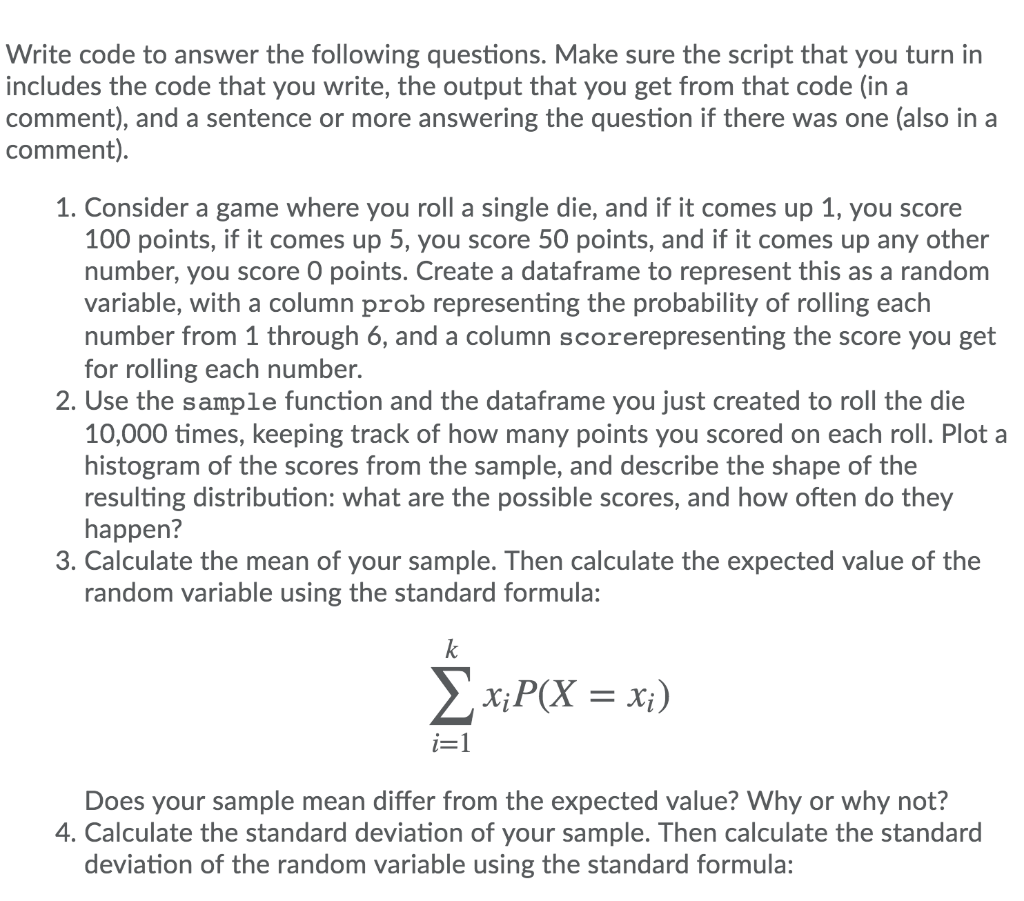
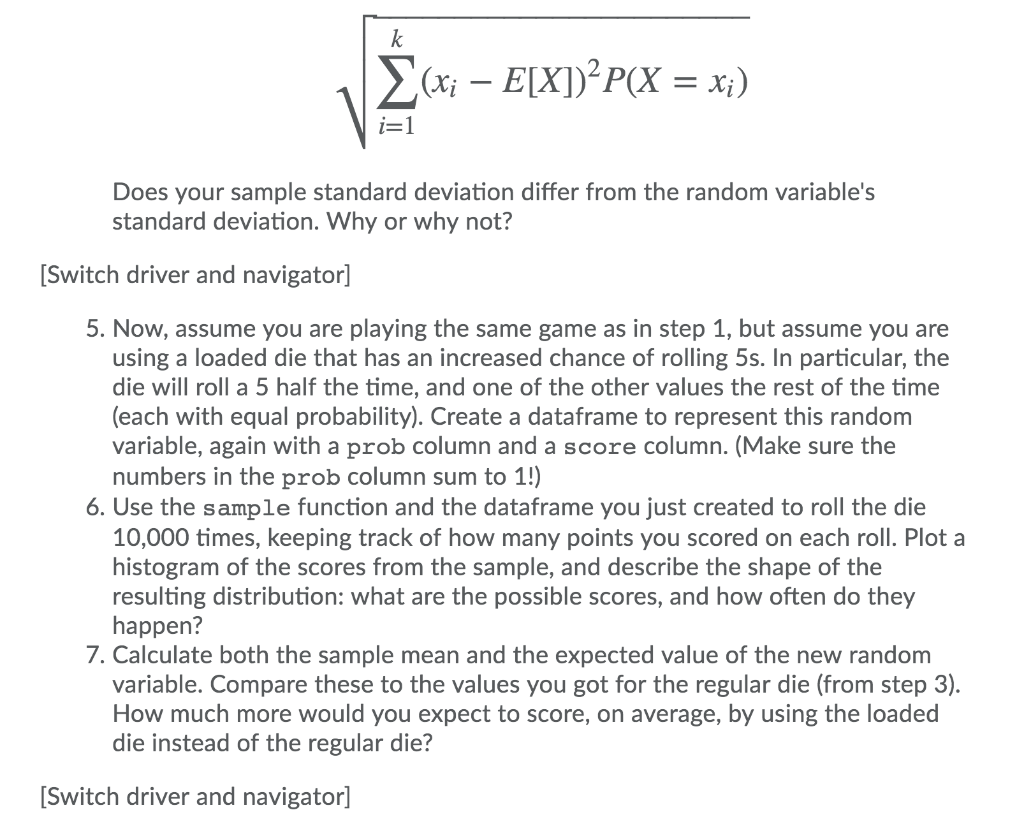
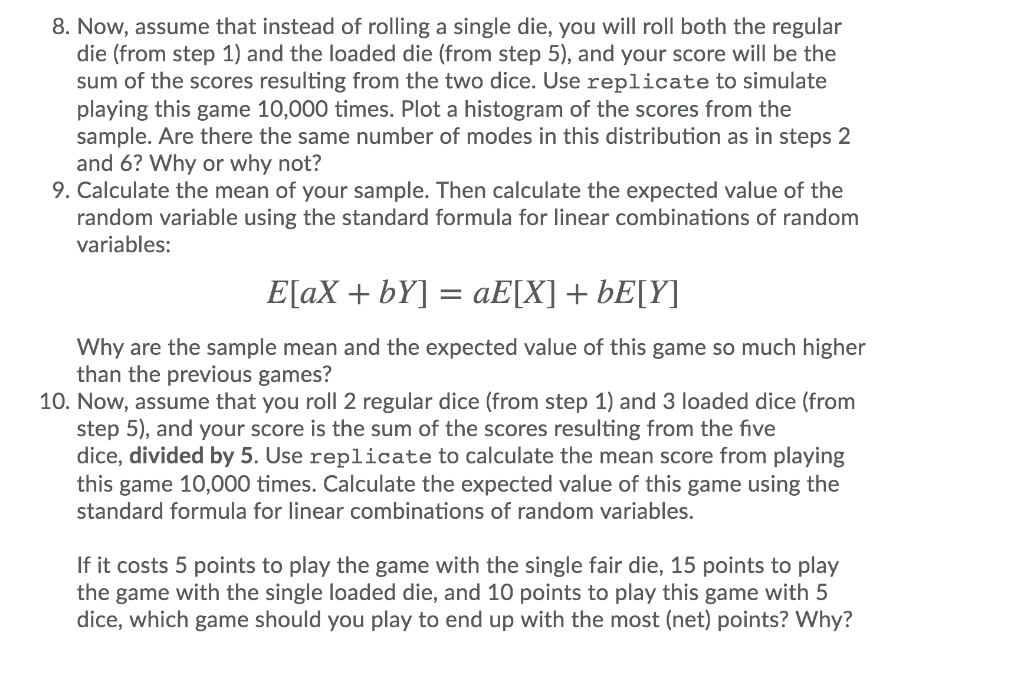
Write code to answer the following questions. Make sure the script that you turn in includes the code that you write, the output that you get from that code (in a comment), and a sentence or more answering the question if there was one (also ina comment,). 1. Consider a game where you roll a single die, and if it comes up 1, you score 100 points, if it comes up 5, you score 50 points, and if it comes up any other number, you score 0 points. Create a dataframe to represent this as a random variable, with a column prob representing the probability of rolling each number from 1 through 6, and a column scorerepresenting the score you get for rolling each number. 2. Use the sample function and the dataframe you just created to roll the die 10,000 times, keeping track of how many points you scored on each roll. Plot a histogram of the scores from the sample, and describe the shape of the resulting distribution: what are the possible scores, and how often do they happen? 3. Calculate the mean of your sample. Then calculate the expected value of the random variable using the standard formula: Does your sample mean differ from the expected value? Why or why not? . Calculate the standard deviation of your sample. Then calculate the standard deviation of the random variable using the standard formula: Does your sample standard deviation differ from the random variable's standard deviation. Why or why not? Switch driver and navigator] 5. Now, assume you are playing the same game as in step 1, but assume you are using a loaded die that has an increased chance of rolling 5s. In particular, the die will roll a 5 half the time, and one of the other values the rest of the time (each with equal probability). Create a dataframe to represent this random variable, again with a prob column and a score column. (Make sure the numbers in the prob column sum to 1!) 6. Use the sample function and the dataframe you just created to roll the die 10,000 times, keeping track of how many points you scored on each roll. Plot a histogram of the scores from the sample, and describe the shape of the resulting distribution: what are the possible scores, and how often do they happen? 7. Calculate both the sample mean and the expected value of the new random variable. Compare these to the values you got for the regular die (from step 3). How much more would you expect to score, on average, by using the loaded die instead of the regular die? Switch driver and navigator] 8. Now, assume that instead of rolling a single die, you will roll both the regular die (from step 1) and the loaded die (from step 5), and your score will be the sum of the scores resulting from the two dice. Use replicate to simulate playing this game 10,000 times. Plot a histogram of the scores from the sample. Are there the same number of modes in this distribution as in steps 2 and 6? Why or why not? 9. Calculate the mean of your sample. Then calculate the expected value of the random variable using the standard formula for linear combinations of random variables: Why are the sample mean and the expected value of this game so much higher than the previous games? 10. Now, assume that you roll 2 regular dice (from step 1) and 3 loaded dice (from step 5), and your score is the sum of the scores resulting from the five dice, divided by 5. Use replicate to calculate the mean score from playing this game 10,000 times. Calculate the expected value of this game using the standard formula for linear combinations of random variables If it costs 5 points to play the game with the single fair die, 15 points to play the game with the single loaded die, and 10 points to play this game with 5 dice, which game should you play to end up with the most (net) points? Why? Write code to answer the following questions. Make sure the script that you turn in includes the code that you write, the output that you get from that code (in a comment), and a sentence or more answering the question if there was one (also ina comment,). 1. Consider a game where you roll a single die, and if it comes up 1, you score 100 points, if it comes up 5, you score 50 points, and if it comes up any other number, you score 0 points. Create a dataframe to represent this as a random variable, with a column prob representing the probability of rolling each number from 1 through 6, and a column scorerepresenting the score you get for rolling each number. 2. Use the sample function and the dataframe you just created to roll the die 10,000 times, keeping track of how many points you scored on each roll. Plot a histogram of the scores from the sample, and describe the shape of the resulting distribution: what are the possible scores, and how often do they happen? 3. Calculate the mean of your sample. Then calculate the expected value of the random variable using the standard formula: Does your sample mean differ from the expected value? Why or why not? . Calculate the standard deviation of your sample. Then calculate the standard deviation of the random variable using the standard formula: Does your sample standard deviation differ from the random variable's standard deviation. Why or why not? Switch driver and navigator] 5. Now, assume you are playing the same game as in step 1, but assume you are using a loaded die that has an increased chance of rolling 5s. In particular, the die will roll a 5 half the time, and one of the other values the rest of the time (each with equal probability). Create a dataframe to represent this random variable, again with a prob column and a score column. (Make sure the numbers in the prob column sum to 1!) 6. Use the sample function and the dataframe you just created to roll the die 10,000 times, keeping track of how many points you scored on each roll. Plot a histogram of the scores from the sample, and describe the shape of the resulting distribution: what are the possible scores, and how often do they happen? 7. Calculate both the sample mean and the expected value of the new random variable. Compare these to the values you got for the regular die (from step 3). How much more would you expect to score, on average, by using the loaded die instead of the regular die? Switch driver and navigator] 8. Now, assume that instead of rolling a single die, you will roll both the regular die (from step 1) and the loaded die (from step 5), and your score will be the sum of the scores resulting from the two dice. Use replicate to simulate playing this game 10,000 times. Plot a histogram of the scores from the sample. Are there the same number of modes in this distribution as in steps 2 and 6? Why or why not? 9. Calculate the mean of your sample. Then calculate the expected value of the random variable using the standard formula for linear combinations of random variables: Why are the sample mean and the expected value of this game so much higher than the previous games? 10. Now, assume that you roll 2 regular dice (from step 1) and 3 loaded dice (from step 5), and your score is the sum of the scores resulting from the five dice, divided by 5. Use replicate to calculate the mean score from playing this game 10,000 times. Calculate the expected value of this game using the standard formula for linear combinations of random variables If it costs 5 points to play the game with the single fair die, 15 points to play the game with the single loaded die, and 10 points to play this game with 5 dice, which game should you play to end up with the most (net) points? Why