Answered step by step
Verified Expert Solution
Question
1 Approved Answer
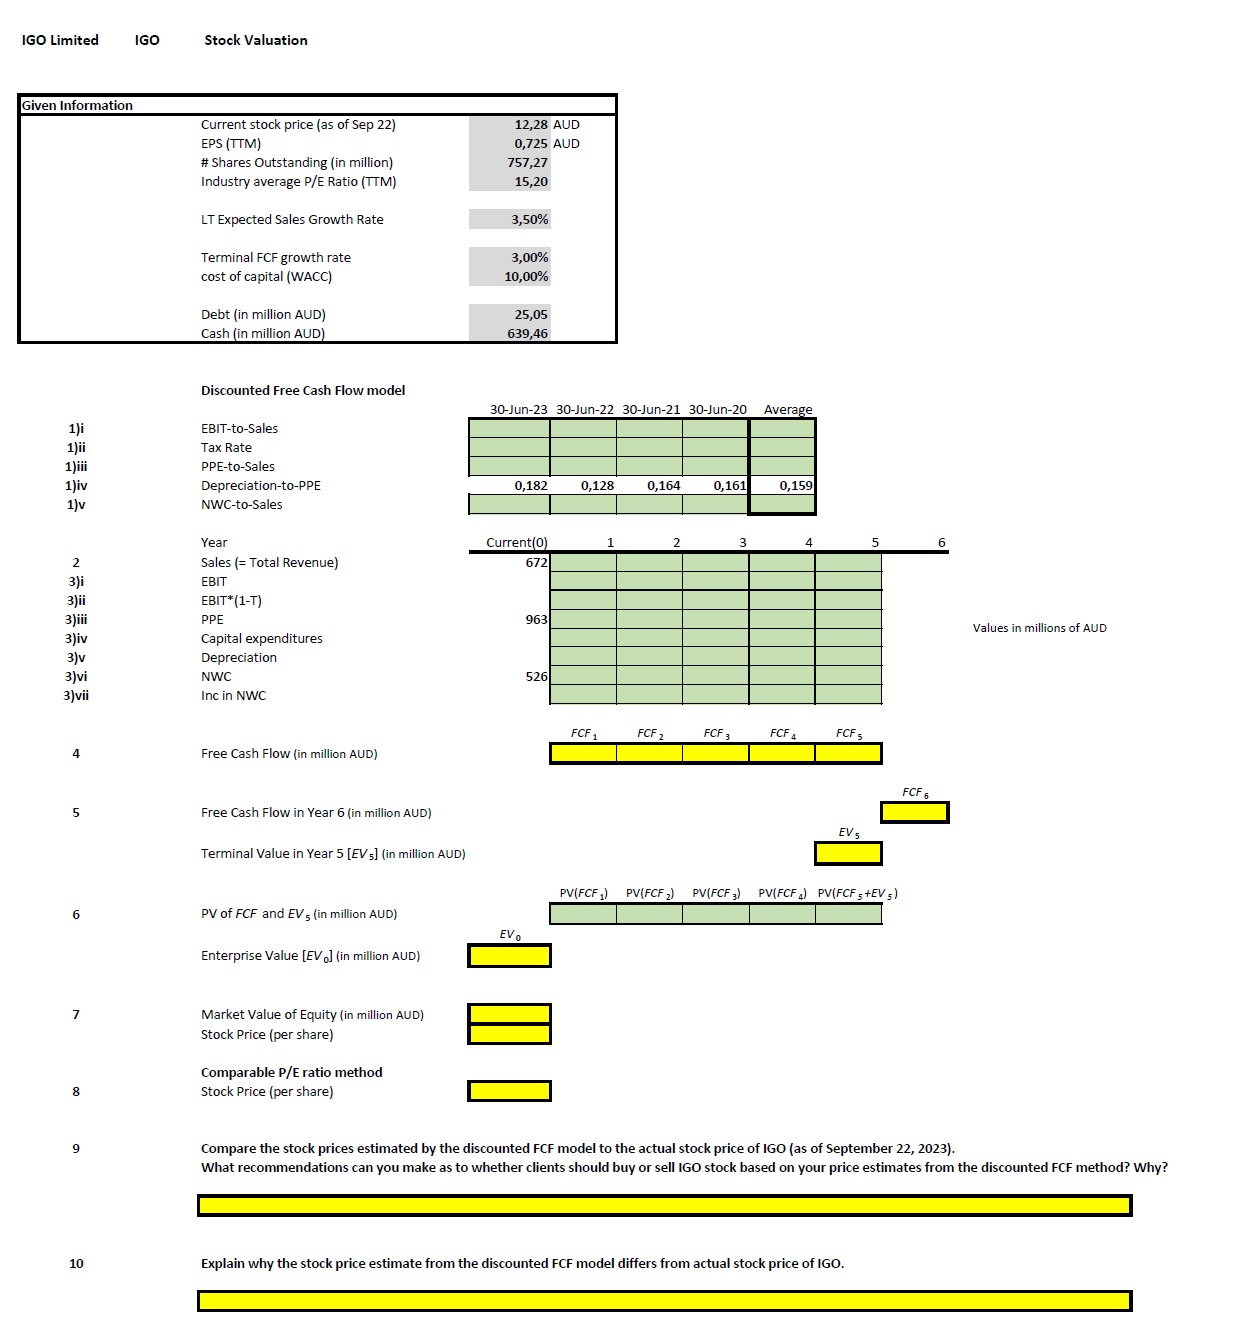
IGO Limited Given Information 1)i 1)ii 1)iii 1)iv 1)V 2 3)i 3)ii 3)iii 3)iv 3)v 3)vi 3)vii 4 5 6 7 8 9 10


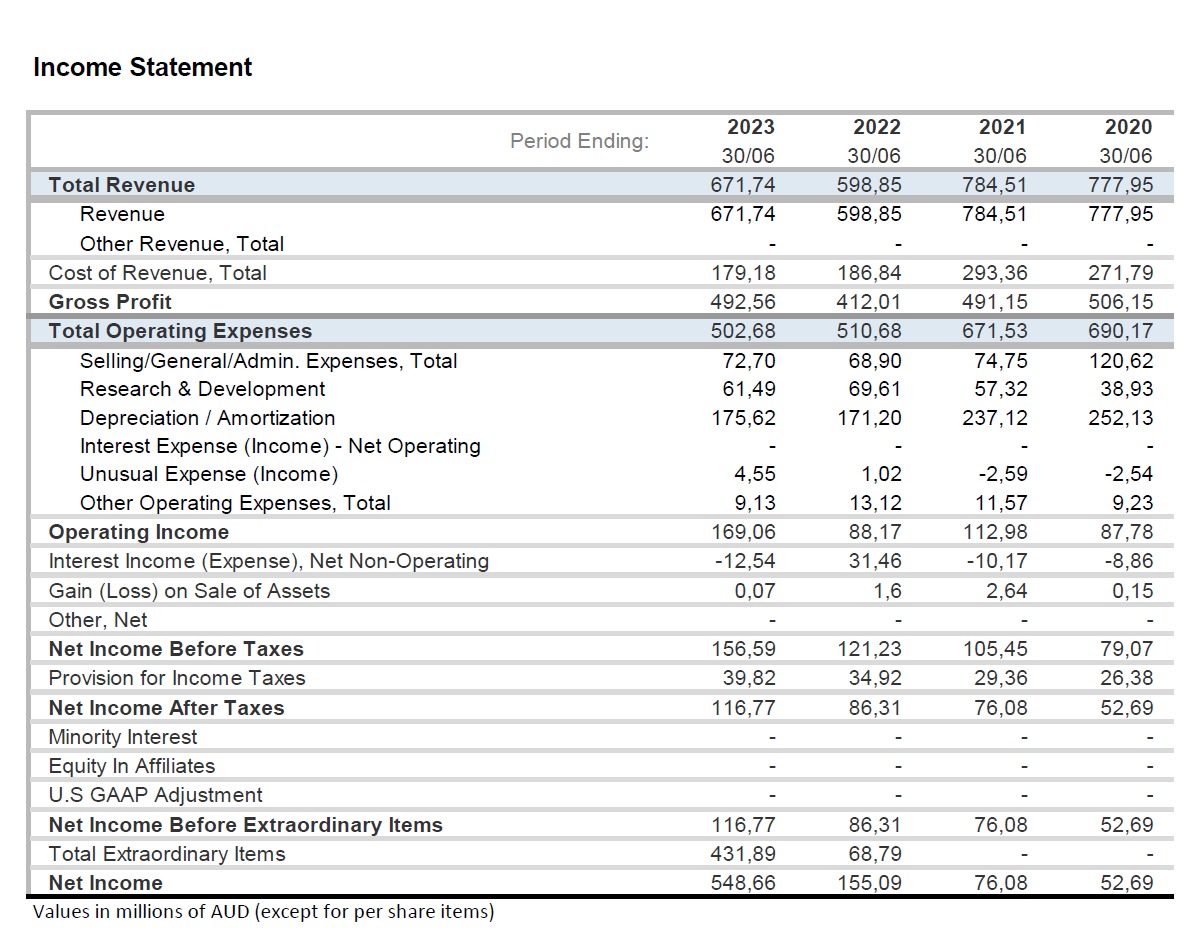
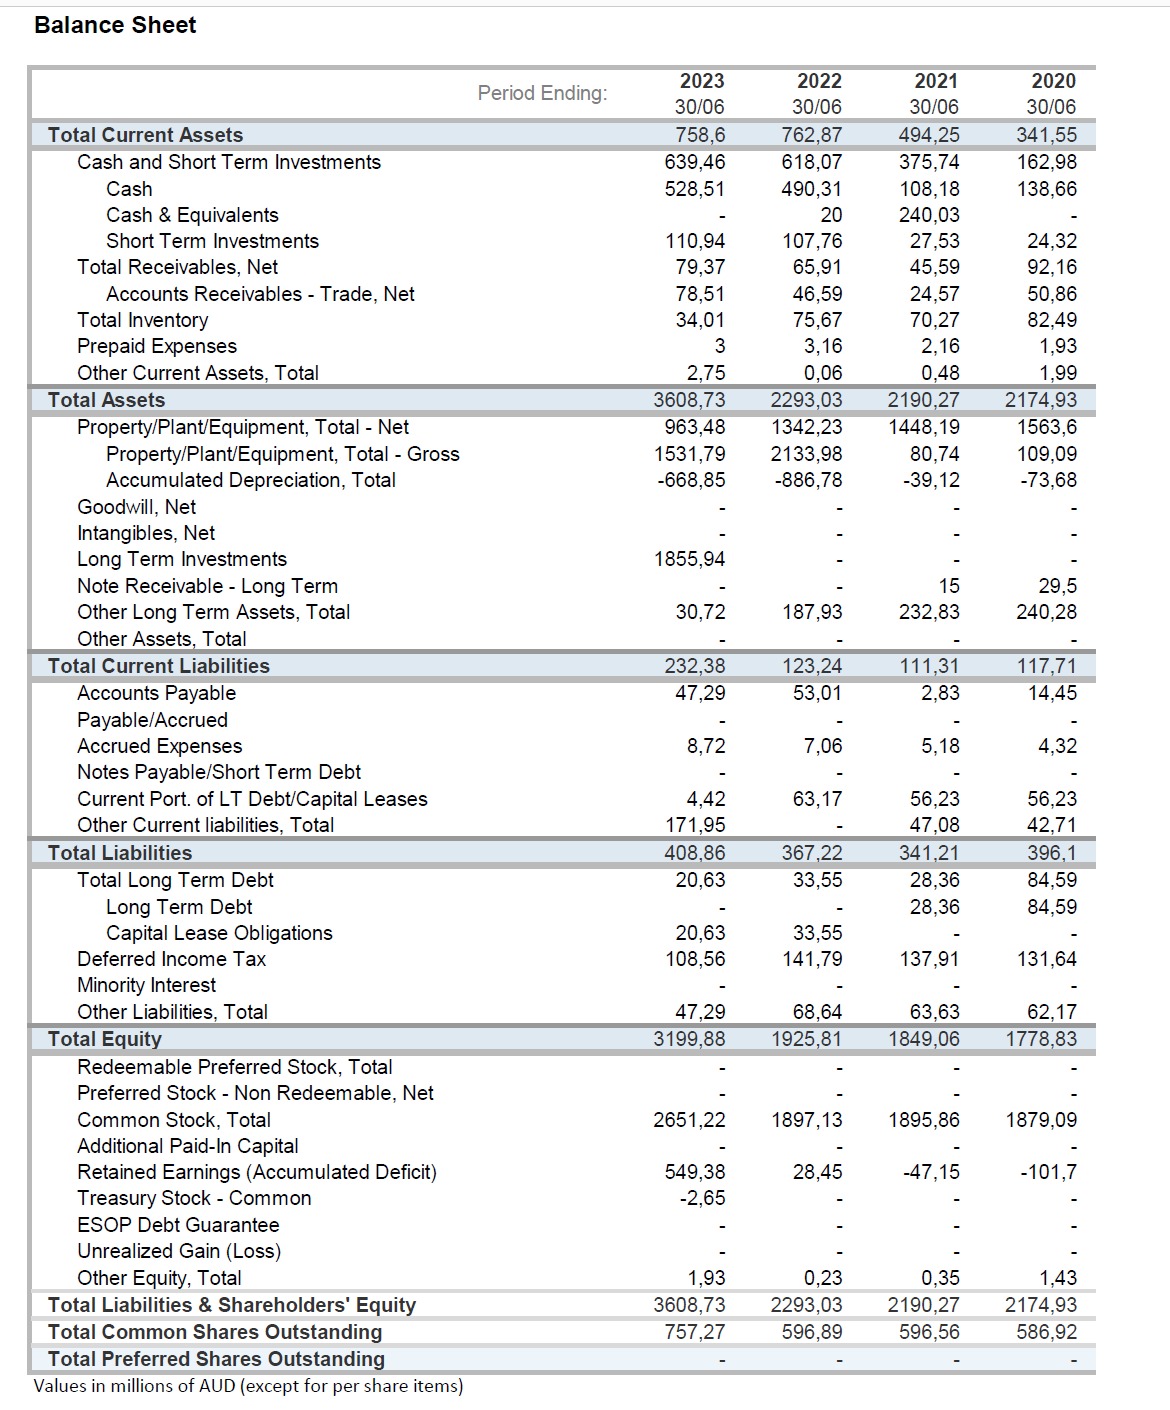
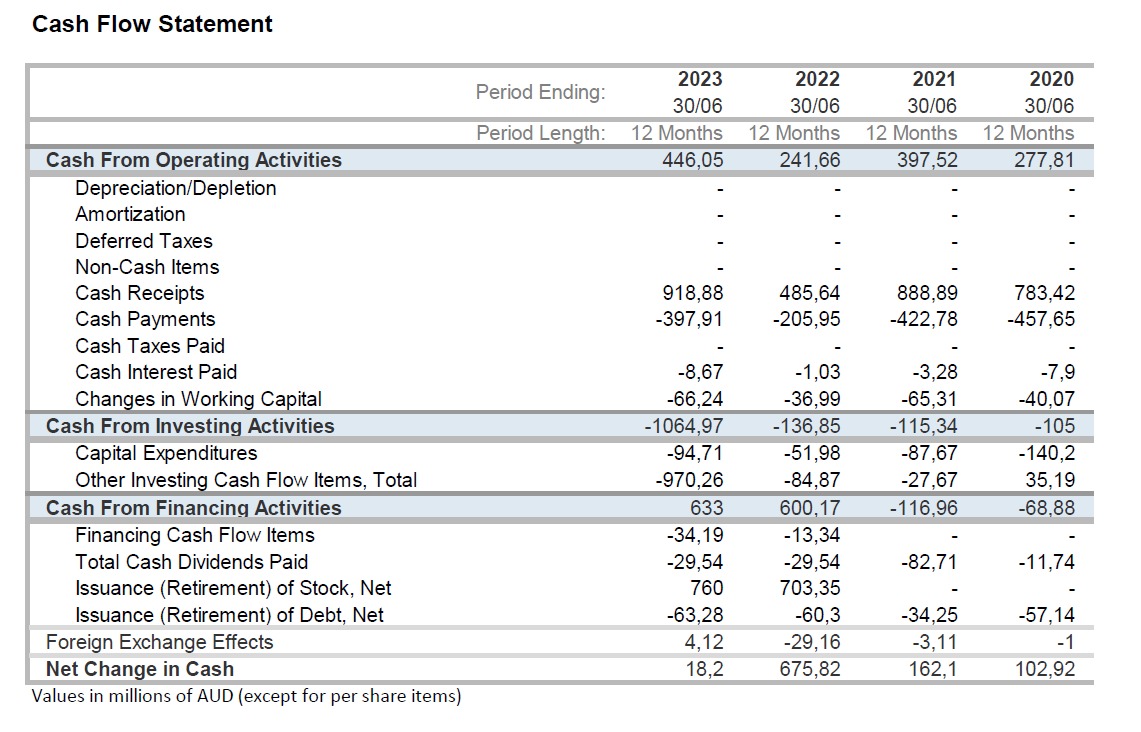
IGO Limited Given Information 1)i 1)ii 1)iii 1)iv 1)V 2 3)i 3)ii 3)iii 3)iv 3)v 3)vi 3)vii 4 5 6 7 8 9 10 IGO Stock Valuation Current stock price (as of Sep 22) EPS (TTM) # Shares Outstanding (in million) Industry average P/E Ratio (TTM) LT Expected Sales Growth Rate Terminal FCF growth rate cost of capital (WACC) Debt (in million AUD) Cash (in million AUD) Discounted Free Cash Flow model EBIT-to-Sales Tax Rate PPE-to-Sales Depreciation-to-PPE NWC-to-Sales Year Sales (= Total Revenue) EBIT EBIT*(1-T) PPE Capital expenditures Depreciation NWC Inc in NWC Free Cash Flow (in million AUD) Free Cash Flow in Year 6 (in million AUD) Terminal Value in Year 5 [EV 5] (in million AUD) PV of FCF and EV 5 (in million AUD) Enterprise Value [EV] (in million AUD) Market Value of Equity (in million AUD) Stock Price (per share) Comparable P/E ratio method Stock Price (per share) 12,28 AUD 0,725 AUD 757,27 15,20 3,50% 3,00% 10,00% 25,05 639,46 30-Jun-23 30-Jun-22 30-Jun-21 30-Jun-20 Average 0,182 Current(0) 672 EVO 963 526 0,128 FCF 1 1 0,164 FCF 2 2 0,161 FCF 3 3 0,159 FCF 4 4 FCF EV 5 PV(FCF ) PV(FCF ) PV(FCF 3) PV(FCF 4) PV(FCF 5 +EV 5) FCF 6 Explain why the stock price estimate from the discounted FCF model differs from actual stock price of IGO. 6 Values in millions of AUD Compare the stock prices estimated by the discounted FCF model to the actual stock price of IGO (as of September 22, 2023). What recommendations can you make as to whether clients should buy or sell IGO stock based on your price estimates from the discounted FCF method? Why? Income Statement Total Revenue Revenue Other Revenue, Total Cost of Revenue, Total Gross Profit Total Operating Expenses Selling/General/Admin. Expenses, Total Research & Development Depreciation / Amortization Interest Expense (Income) - Net Operating Unusual Expense (Income) Other Operating Expenses, Total Operating Income Interest Income (Expense), Net Non-Operating Gain (Loss) on Sale of Assets Other, Net Net Income Before Taxes Provision for Income Taxes Net Income After Taxes Minority Interest Equity In Affiliates U.S GAAP Adjustment Net Income Before Extraordinary Items Total Extraordinary Items Net Income Values in millions of AUD (except for per share items) Period Ending: 2023 30/06 671,74 671,74 179,18 492,56 502,68 72,70 61,49 175,62 4,55 9,13 169,06 -12,54 0,07 156,59 39,82 116,77 116,77 431,89 548,66 2022 30/06 598,85 598,85 186,84 412,01 510,68 68,90 69,61 171,20 1,02 13,12 88,17 31,46 1,6 121,23 34,92 86,31 86,31 68,79 155,09 2021 30/06 784,51 784,51 293,36 491,15 671,53 74,75 57,32 237,12 -2,59 11,57 112,98 -10,17 2,64 105,45 29,36 76,08 76,08 76,08 2020 30/06 777,95 777,95 271,79 506,15 690,17 120,62 38,93 252,13 -2,54 9,23 87,78 -8,86 0,15 79,07 26,38 52,69 52,69 52,69 Balance Sheet Total Current Assets Cash and Short Term Investments Cash Cash & Equivalents Short Term Investments Total Receivables, Net Accounts Receivables - Trade, Net Total Inventory Prepaid Expenses Other Current Assets, Total Total Assets Property/Plant/Equipment, Total - Net Property/Plant/Equipment, Total - Gross Accumulated Depreciation, Total Goodwill, Net Intangibles, Net Long Term Investments Note Receivable - Long Term Other Long Term Assets, Total Other Assets, Total Total Current Liabilities Accounts Payable Payable/Accrued Accrued Expenses Notes Payable/Short Term Debt Current Port. of LT Debt/Capital Leases Other Current liabilities, Total Total Liabilities Total Long Term Debt Long Term Debt Capital Lease Obligations Deferred Income Tax Minority Interest Other Liabilities, Total Total Equity Redeemable Preferred Stock, Total Preferred Stock - Non Redeemable, Net Common Stock, Total Additional Paid-In Capital Retained Earnings (Accumulated Deficit) Treasury Stock - Common ESOP Debt Guarantee Unrealized Gain (Loss) Other Equity, Total Total Liabilities & Shareholders' Equity Total Common Shares Outstanding Total Preferred Shares Outstanding Values in millions of AUD (except for per share items) Period Ending: 2023 30/06 758,6 639,46 528,51 1855,94 30,72 110,94 79,37 78,51 34,01 3 2,75 3608,73 2293,03 963,48 1342,23 1531,79 2133,98 -668,85 -886,78 232,38 47,29 8,72 4,42 171,95 408,86 20,63 20,63 108,56 47,29 3199,88 2022 30/06 549,38 -2,65 762,87 618,07 490,31 1,93 3608,73 757,27 20 107,76 65,91 46,59 75,67 3,16 0,06 187,93 123,24 53,01 7,06 63,17 367,22 33,55 33,55 141,79 2651,22 1897,13 68,64 1925,81 28,45 0,23 2293,03 596,89 2021 30/06 494,25 375,74 108,18 240,03 27,53 45,59 24,57 70,27 2,16 0,48 2190,27 1448,19 80,74 -39,12 15 232,83 111,31 2,83 5,18 56,23 47,08 341,21 28,36 28,36 137,91 63,63 1849,06 1895,86 -47,15 0,35 2190,27 596,56 2020 30/06 341,55 162,98 138,66 24,32 92,16 50,86 82,49 1,93 1,99 2174,93 1563,6 109,09 -73,68 29,5 240,28 117,71 14,45 4,32 56,23 42,71 396,1 84,59 84,59 131,64 62,17 1778,83 1879,09 -101,7 1,43 2174,93 586,92 Cash Flow Statement Cash From Operating Activities Depreciation/Depletion Amortization Deferred Taxes Non-Cash Items Cash Receipts Cash Payments Cash Taxes Paid Cash Interest Paid Changes in Working Capital Cash From Investing Activities Capital Expenditures Other Investing Cash Flow Items, Total Cash From Financing Activities Financing Cash Flow Items Total Cash Dividends Paid Issuance (Retirement) of Stock, Net Issuance (Retirement) of Debt, Net Foreign Exchange Effects Net Change in Cash Values in millions of AUD (except for per share items) 2023 Period Ending: 30/06 Period Length: 12 Months 446,05 918,88 -397,91 -8,67 -66,24 -1064,97 -94,71 -970,26 633 -34,19 -29,54 760 -63,28 4,12 18,2 2022 2021 2020 30/06 30/06 30/06 12 Months 12 Months 12 Months 241,66 397,52 277,81 485,64 888,89 -205,95 -422,78 -1,03 -36,99 -136,85 -51,98 -84,87 600,17 -13,34 -29,54 703,35 -60,3 -29,16 675,82 -3,28 -65,31 -115,34 -87,67 -27,67 -116,96 -82,71 -34,25 -3,11 162,1 783,42 -457,65 -7,9 -40,07 -105 -140,2 35,19 -68,88 -11,74 -57,14 -1 102,92
Step by Step Solution
★★★★★
3.30 Rating (153 Votes )
There are 3 Steps involved in it
Step: 1
Here are the detailed calculations for the DCF valuation of IGO Limited Income Statement Fore...
Get Instant Access to Expert-Tailored Solutions
See step-by-step solutions with expert insights and AI powered tools for academic success
Step: 2

Step: 3

Ace Your Homework with AI
Get the answers you need in no time with our AI-driven, step-by-step assistance
Get Started


