Question
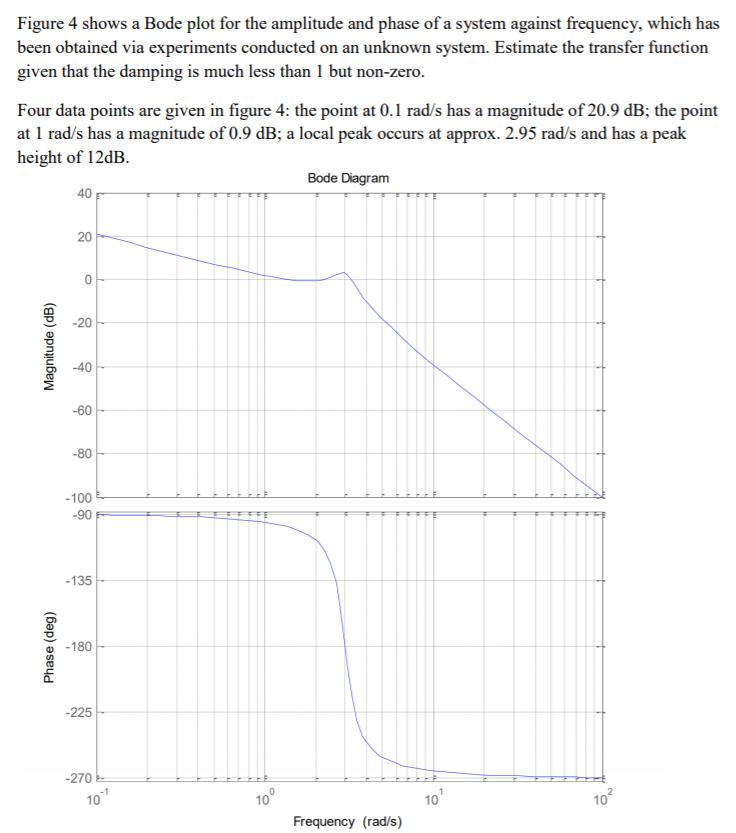
Figure 4 shows a Bode plot for the amplitude and phase of a system against frequency, which has been obtained via experiments conducted on

Figure 4 shows a Bode plot for the amplitude and phase of a system against frequency, which has been obtained via experiments conducted on an unknown system. Estimate the transfer function given that the damping is much less than 1 but non-zero. Four data points are given in figure 4: the point at 0.1 rad/s has a magnitude of 20.9 dB; the point at 1 rad/s has a magnitude of 0.9 dB; a local peak occurs at approx. 2.95 rad/s and has a peak height of 12dB. Bode Diagram 40 20 -20 -40 -60 -80 -100 -90 -135 -180 -225 -270 10 10 10' Frequency (rad/s) 10 (6ep) seud Magnitude (dB)
Step by Step Solution
3.51 Rating (151 Votes )
There are 3 Steps involved in it
Step: 1
20 2018 od8 2 nY c Ip 60z 209 2 20 ...
Get Instant Access to Expert-Tailored Solutions
See step-by-step solutions with expert insights and AI powered tools for academic success
Step: 2

Step: 3

Ace Your Homework with AI
Get the answers you need in no time with our AI-driven, step-by-step assistance
Get StartedRecommended Textbook for
Fundamentals Of Electric Circuits
Authors: Matthew Sadiku, Charles Alexander
3rd Edition
978-0073301150, 0073301159
Students also viewed these Accounting questions
Question
Answered: 1 week ago
Question
Answered: 1 week ago
Question
Answered: 1 week ago
Question
Answered: 1 week ago
Question
Answered: 1 week ago
Question
Answered: 1 week ago
Question
Answered: 1 week ago
Question
Answered: 1 week ago
Question
Answered: 1 week ago
Question
Answered: 1 week ago
Question
Answered: 1 week ago
Question
Answered: 1 week ago
Question
Answered: 1 week ago
Question
Answered: 1 week ago
Question
Answered: 1 week ago
Question
Answered: 1 week ago
Question
Answered: 1 week ago
Question
Answered: 1 week ago
Question
Answered: 1 week ago
Question
Answered: 1 week ago
Question
Answered: 1 week ago
Question
Answered: 1 week ago
Question
Answered: 1 week ago
View Answer in SolutionInn App


