Answered step by step
Verified Expert Solution
Question
1 Approved Answer
II. An Usher matrix model is a slight variation on a Leslie model, in which there may be nonzero entries on the diagonal. This means
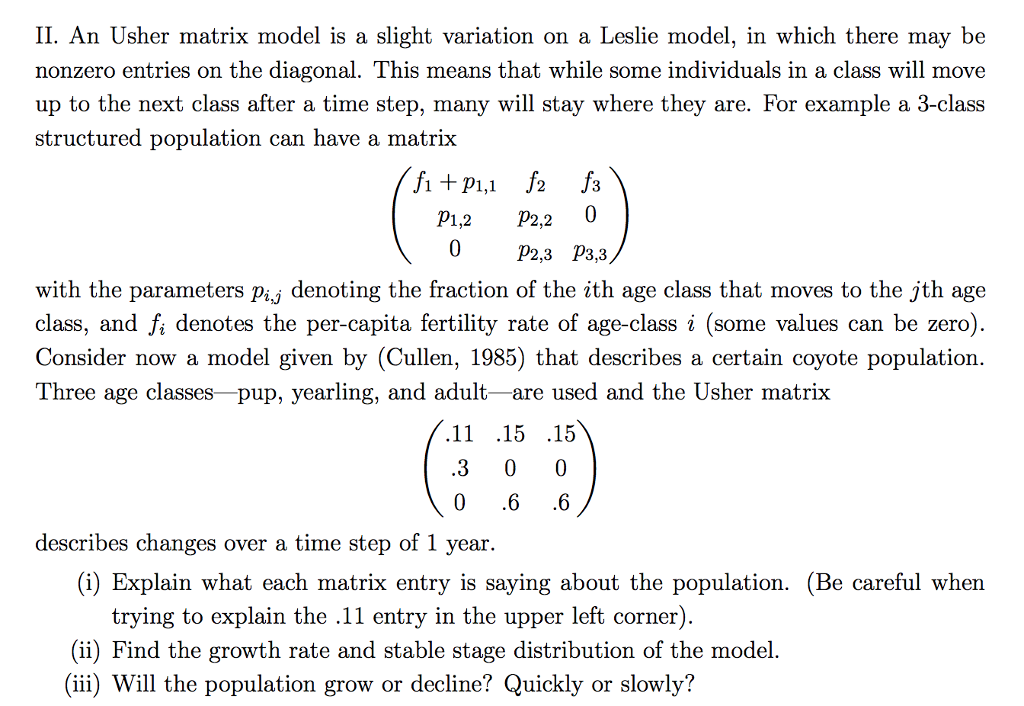
II. An Usher matrix model is a slight variation on a Leslie model, in which there may be nonzero entries on the diagonal. This means that while some individuals in a class will move up to the next class after a time step, many will stay where they are. For example a 3-class structured population can have a matrix P1,2 P2,2 0 P2,3 P3,3 with the parameters Pij denoting the fraction of the ith age class that moves to the jth age class, and f, denotes the per-capita fertility rate of age-class i (some values can be zero Consider now a model given by (Cullen, 1985) that describes a certain coyote population. Three age classes - pup, yearling, and adult-are used and the Usher matrix 11 .15 .15 3 0 0 describes changes over a time step of 1 year (i) Explain what each matrix entry is saying about the population. (Be careful when trying to explain the .11 entry in the upper left corner (ii) Find the growth rate and stable stage distribution of the model (iii) Will the population grow or decline? Quickly or slowly? II. An Usher matrix model is a slight variation on a Leslie model, in which there may be nonzero entries on the diagonal. This means that while some individuals in a class will move up to the next class after a time step, many will stay where they are. For example a 3-class structured population can have a matrix P1,2 P2,2 0 P2,3 P3,3 with the parameters Pij denoting the fraction of the ith age class that moves to the jth age class, and f, denotes the per-capita fertility rate of age-class i (some values can be zero Consider now a model given by (Cullen, 1985) that describes a certain coyote population. Three age classes - pup, yearling, and adult-are used and the Usher matrix 11 .15 .15 3 0 0 describes changes over a time step of 1 year (i) Explain what each matrix entry is saying about the population. (Be careful when trying to explain the .11 entry in the upper left corner (ii) Find the growth rate and stable stage distribution of the model (iii) Will the population grow or decline? Quickly or slowly
Step by Step Solution
There are 3 Steps involved in it
Step: 1
Get Instant Access to Expert-Tailored Solutions
See step-by-step solutions with expert insights and AI powered tools for academic success
Step: 2
Step: 3
Ace Your Homework with AI
Get the answers you need in no time with our AI-driven, step-by-step assistance
Get Started