Answered step by step
Verified Expert Solution
Question
1 Approved Answer
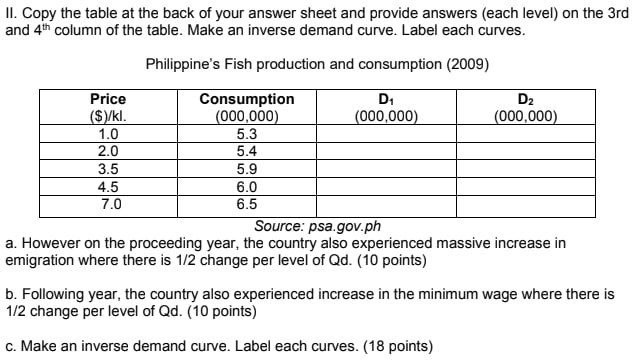
II. Copy the table at the back of your answer sheet and provide answers (each level) on the 3rd and 4th column of the

II. Copy the table at the back of your answer sheet and provide answers (each level) on the 3rd and 4th column of the table. Make an inverse demand curve. Label each curves. Philippine's Fish production and consumption (2009) Consumption (000,000) 5.3 5.4 Price ($)/kl. 1.0 2.0 3.5 4.5 7.0 5.9 6.0 6.5 D (000,000) D (000,000) Source: psa.gov.ph a. However on the proceeding year, the country also experienced massive increase in emigration where there is 1/2 change per level of Qd. (10 points) b. Following year, the country also experienced increase in the minimum wage where there is 1/2 change per level of Qd. (10 points) c. Make an inverse demand curve. Label each curves. (18 points)
Step by Step Solution
There are 3 Steps involved in it
Step: 1
Here is the table with the answers Price kl Consumption 0...
Get Instant Access to Expert-Tailored Solutions
See step-by-step solutions with expert insights and AI powered tools for academic success
Step: 2

Step: 3

Ace Your Homework with AI
Get the answers you need in no time with our AI-driven, step-by-step assistance
Get Started


