

Answered step by step
Verified Expert Solution
Question
1 Approved Answer
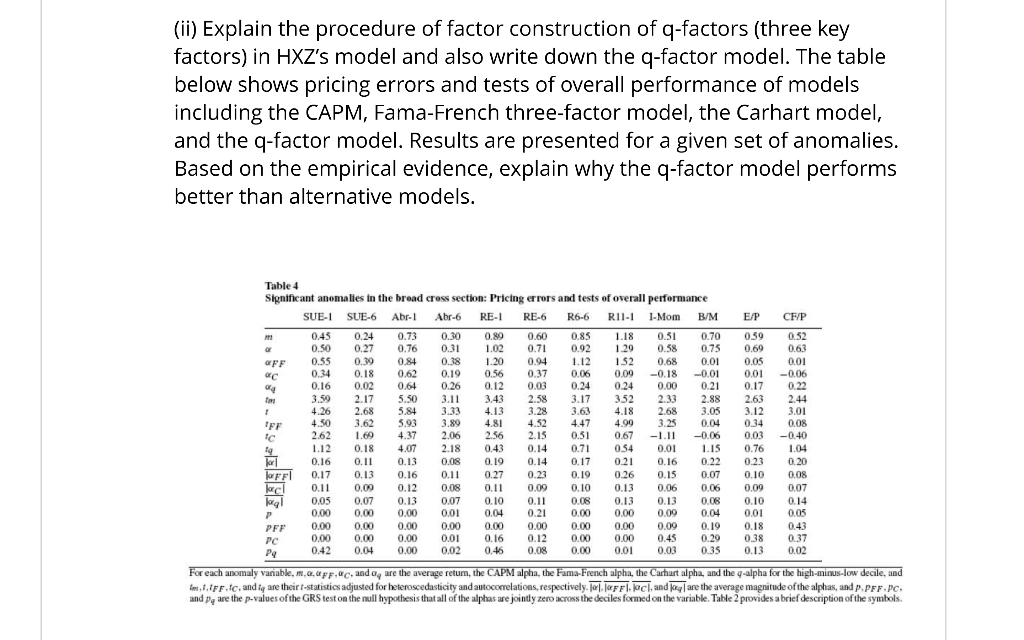
(ii) Explain the procedure of factor construction of q-factors (three key factors) in HXZ's model and also write down the q-factor model. The table below
Step by Step Solution
There are 3 Steps involved in it
Step: 1

Get Instant Access to Expert-Tailored Solutions
See step-by-step solutions with expert insights and AI powered tools for academic success
Step: 2

Step: 3
Ace Your Homework with AI
Get the answers you need in no time with our AI-driven, step-by-step assistance
Get Started
Passive Income
Authors: Brian Stclair
1st Edition
1539739694, 978-1539739692