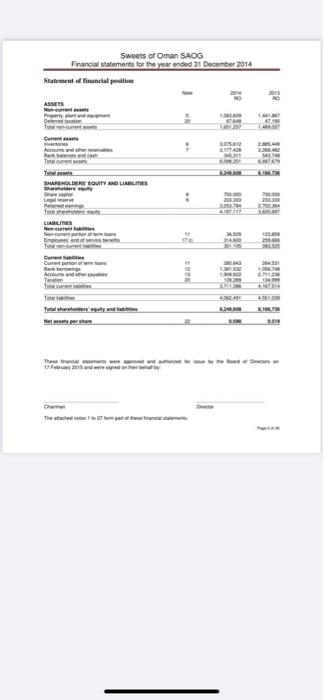
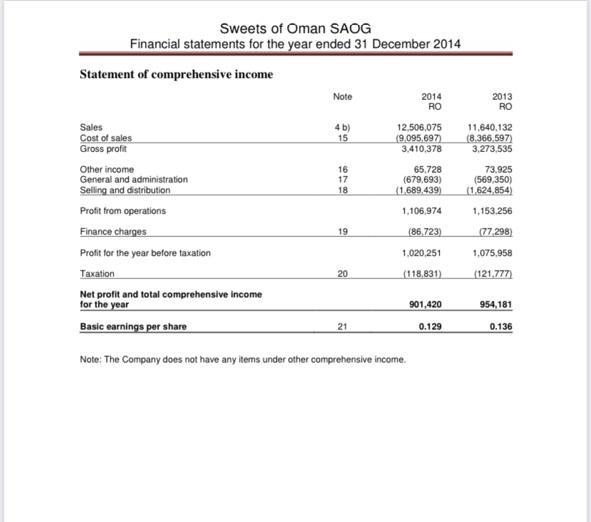
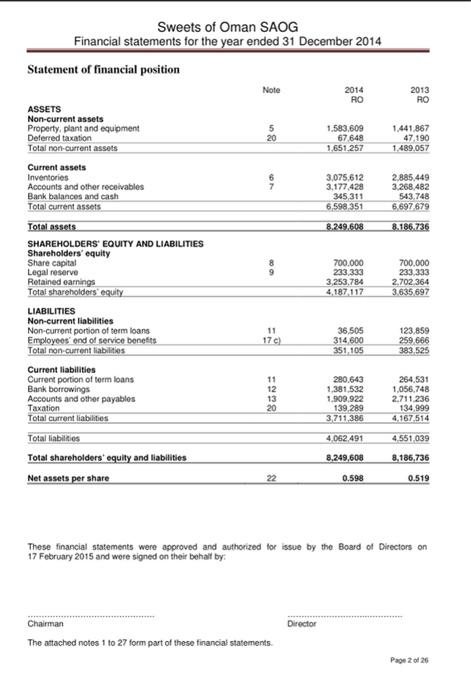
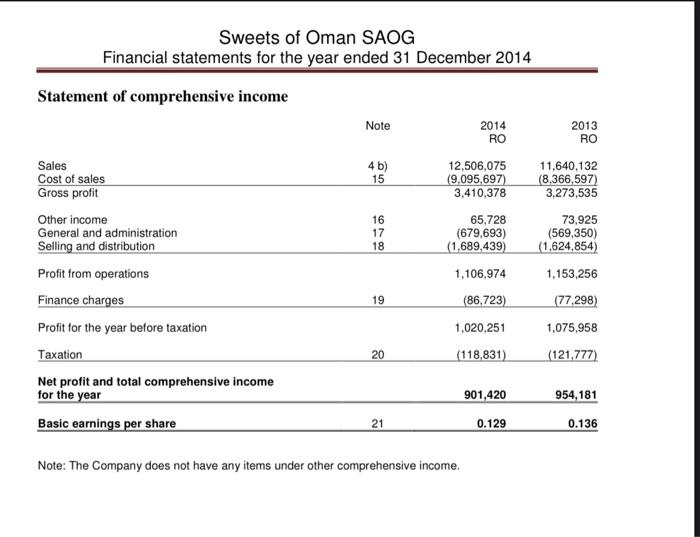
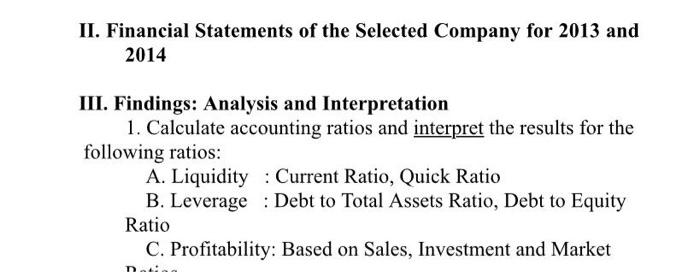
II. Financial Statements of the Selected Company for 2013 and 2014 III. Findings: Analysis and Interpretation 1. Calculate accounting ratios and interpret the results for the following ratios: A. Liquidity : Current Ratio, Quick Ratio B. Leverage : Debt to Total Assets Ratio, Debt to Equity Ratio C. Profitability: Based on Sales, Investment and Market Sweets of Oman SAOG Financial statements for the year ended 31 December 2014 Statement financial pentin ASSES vo Andrew More www th Le . LIABILITIES re mo 33 Current A To 17F2015 Sweets of Oman SAOG Financial statements for the year ended 31 December 2014 Statement of comprehensive income Note 2014 RO 2013 RO 4b) 15 12,506,075 (9.095.697) 3,410,378 11,640,132 (8.366.597) 3.273,535 16 17 18 65,728 (679,693) (1.689,439 73.925 (569,350) (1.624 854) 1,106,974 1.153.256 Sales Cost of sales Gross profit Other income General and administration Selling and distribution Profit from operations Finance charges Profit for the year before taxation Taxation Net profit and total comprehensive Income for the year Basic earnings per share 19 (86.723) 77,298) 1.020.251 1,075,958 20 (118,831 (121.777 901,420 954,181 0.136 21 0.129 Note: The Company does not have any items under other comprehensive income Sweets of Oman SAOG Financial statements for the year ended 31 December 2014 Statement of financial position Note 2014 2013 RO RO 5 20 1.583,609 67 648 1.651.257 1.441.867 47.190 1.489.057 ASSETS Non-current assets Property, plant and equipment Deferred taxation Total non-current assets Current assets Inventories Accounts and other receivables Bank balances and cash Total current assets IN 3,075,612 3,177,428 345 311 6,598,351 2.885,449 3.268.482 543,748 6,697 679 8.249.608 8.186.736 700.000 233,333 3 253,784 4,187 117 700,000 233 333 2.702 364 3.635 697 176) Total assets SHAREHOLDERS' EQUITY AND LIABILITIES Shareholders' equity Share capital Legal reserve Retained earnings Total shareholders' equity LIABILITIES Non-current liabilities Non-current portion of term loans Employees' end of service benefits Total non current liabilities Current liabilities Current portion of torm loans Bank borrowings Accounts and other payables Taxation Total current liabilities Total liabilities Total shareholders' equity and liabilities Net assets per share 36,505 314 600 351.105 123.859 259 666 383 525 11 12 13 20 280.643 1,381,532 1.909.922 139 289 3.711,386 264.531 1,056.748 2.711.236 134,999 4.167.514 4,062.491 4.551.039 8.249,608 8,186,736 22 0.598 0.519 These financial statements were approved and authorized for issue by the Board of Directors on 17 February 2015 and were signed on their behalt by Chairman Director The attached notos 1 to 27 form part of these financial statements. Page 2 of 26 Sweets of Oman SAOG Financial statements for the year ended 31 December 2014 Statement of comprehensive income Note 2014 RO 2013 RO 4b) 15 11,640,132 (8.366,597) 3,273,535 12,506,075 (9,095,697) 3,410,378 65,728 (679,693) (1,689,439) 16 17 18 Sales Cost of sales Gross profit Other income General and administration Selling and distribution Profit from operations Finance charges Profit for the year before taxation Taxation Net profit and total comprehensive income for the year Basic earnings per share 73,925 (569,350) (1.624,854) 1,153,256 (77.298) 1,106,974 (86.723) 19 1,020,251 1,075,958 20 (118,831) (121,777) 901,420 954,181 21 0.129 0.136 Note: The Company does not have any items under other comprehensive income. II. Financial Statements of the Selected Company for 2013 and 2014 III. Findings: Analysis and Interpretation 1. Calculate accounting ratios and interpret the results for the following ratios: A. Liquidity : Current Ratio, Quick Ratio B. Leverage : Debt to Total Assets Ratio, Debt to Equity Ratio C. Profitability: Based on Sales, Investment and Market
