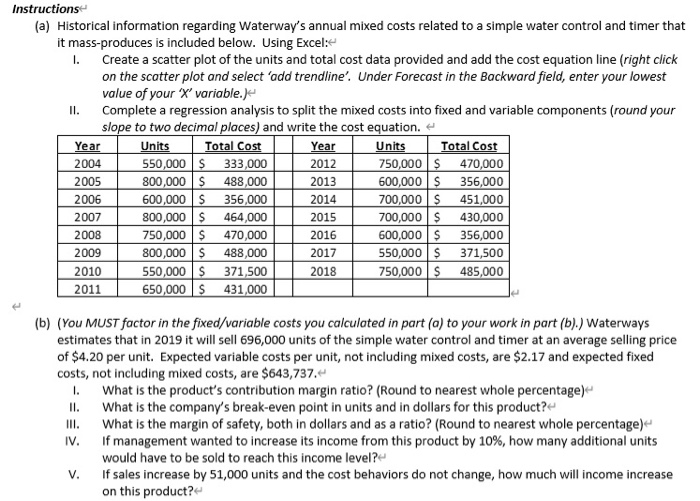
II. Instructions (a) Historical information regarding Waterway's annual mixed costs related to a simple water control and timer that it mass-produces is included below. Using Excel: 1. Create a scatter plot of the units and total cost data provided and add the cost equation line (right click on the scatter plot and select 'add trendline'. Under Forecast in the Backward field, enter your lowest value of your 'X' variable.) Complete a regression analysis to split the mixed costs into fixed and variable components (round your slope to two decimal places) and write the cost equation. Year Units Total Cost Year Units Total Cost 2004 550,000 S 333,000 2012 750,000 $ 470,000 2005 800,000 S 488,000 2013 600,000 $ 356,000 2006 600,000 S 356,000 2014 700,000 $ 451,000 2007 800,000 $ 464,000 2015 700,000 $ 430,000 2008 750,000 $ 470,000 2016 600,000 $ 356,000 2009 800,000 $ 488,000 2017 550,000 $ 371,500 2010 550,000 S 371,500 2018 750,000 $ 485,000 2011 650,000 $431,000 (b) (YOU MUST factor in the fixed/variable costs you calculated in part (a) to your work in part (b).) Waterways estimates that in 2019 it will sell 696,000 units of the simple water control and timer at an average selling price of $4.20 per unit. Expected variable costs per unit, not including mixed costs, are $2.17 and expected fixed costs, not including mixed costs, are $643,737.- 1. What is the product's contribution margin ratio? (Round to nearest whole percentage) II. What is the company's break-even point in units and in dollars for this product? What is the margin of safety, both in dollars and as a ratio? (Round to nearest whole percentage) IV. If management wanted to increase its income from this product by 10%, how many additional units would have to be sold to reach this income level? V. if sales increase by 51,000 units and the cost behaviors do not change, how much will income increase on this product