Answered step by step
Verified Expert Solution
Question
1 Approved Answer
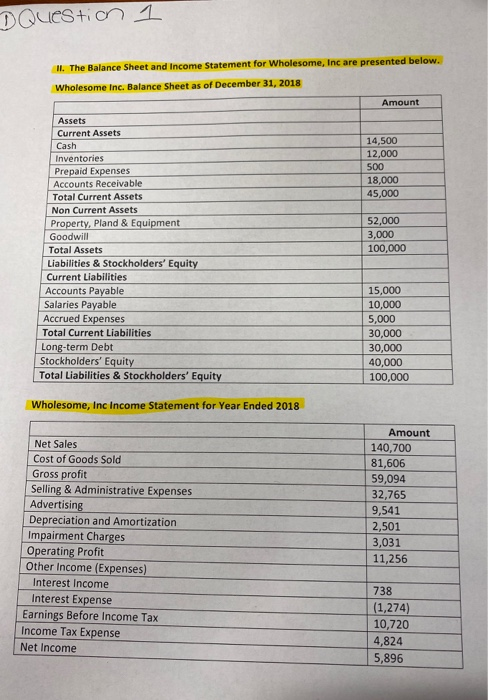
II. The Balance Sheet and Income Statement for Wholesome , Inc are presented below. Wholesome Inc. Balance Sheet as of December 31, 2018 a. Prepare


II. The Balance Sheet and Income Statement for Wholesome , Inc are presented below. Wholesome Inc. Balance Sheet as of December 31, 2018
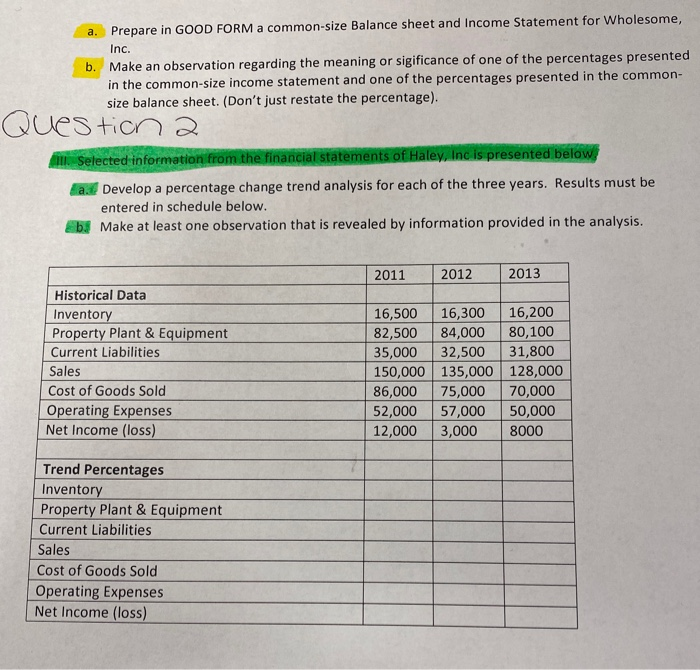
DQuestion 1 II. The Balance Sheet and Income Statement for Wholesome, Inc are presented below. Wholesome Inc. Balance Sheet as of December 31, 2018 Amount 14.500 12.000 500 18,000 45,000 Assets Current Assets Cash Inventories Prepaid Expenses Accounts Receivable Total Current Assets Non Current Assets Property, Pland & Equipment Goodwill Total Assets Liabilities & Stockholders' Equity Current Liabilities Accounts Payable Salaries Payable Accrued Expenses Total Current Liabilities Long-term Debt Stockholders' Equity Total Liabilities & Stockholders' Equity 52,000 3,000 100,000 | 15,000 10,000 5,000 30,000 30,000 40,000 100,000 Wholesome, Inc Income Statement for Year Ended 2018 Net Sales Cost of Goods Sold Gross profit Selling & Administrative Expenses Advertising Depreciation and Amortization Impairment Charges Operating Profit Other Income (Expenses) Interest Income Interest Expense Earnings Before Income Tax Income Tax Expense Net Income Amount 140,700 81,606 59,094 32,765 9,541 2,501 3,031 11,256 738 (1,274) 10,720 4,824 5,896 a. Prepare in GOOD FORM a common-size Balance sheet and Income Statement for Wholesome, Inc. b. Make an observation regarding the meaning or sigificance of one of the percentages presented in the common-size income statement and one of the percentages presented in the common- size balance sheet. (Don't just restate the percentage). Question a i Selected information from the financial statements of Haley, Inc is presented below Develop a percentage change trend analysis for each of the three years. Results must be entered in schedule below. b) Make at least one observation that is revealed by information provided in the analysis. 2011 2012 2013 Historical Data Inventory Property Plant & Equipment Current Liabilities Sales Cost of Goods Sold Operating Expenses Net Income (loss) 16,500 82,500 35,000 150,000 86,000 52,000 12,000 16,300 84,000 32,500 135,000 75,000 57,000 3,000 16,200 80,100 31,800 128,000 70,000 50,000 8000 Trend Percentages Inventory Property Plant & Equipment Current Liabilities Sales Cost of Goods Sold Operating Expenses Net Income (loss) a. Prepare in GOOD FORM a common-size Balance sheet and Income Statement for Wholesome, Inc.
b. Make an observation regarding the meaning or sigificance of one of the percentages presented in the common-size income statement and one of the percentages presented in the common size balance sheet. (Don't just restate the percentage).
Question 2
Selected information from the financial statements of Haley, Inc is presented below.
a. Develop a percentage change trend analysis for each of the three years. Results must be entered in schedule below.
b.Make least one observation that is revealed by information provided in the analysis.
Step by Step Solution
There are 3 Steps involved in it
Step: 1

Get Instant Access to Expert-Tailored Solutions
See step-by-step solutions with expert insights and AI powered tools for academic success
Step: 2

Step: 3

Ace Your Homework with AI
Get the answers you need in no time with our AI-driven, step-by-step assistance
Get Started


