Question
ii) Using the financial statements, perform ratio analyses of the company at group levels for two years. Provide interpretations of the ratios. You are required
ii) Using the financial statements, perform ratio analyses of the company at group levels for two years. Provide interpretations of the ratios. You are required to assess the following : profitability: including gross profit margin, net profit margin, operating profit margin, return on assets, return on equity ratios. liquidity : including current ratios, quick ratios, cash ratio. leverage : debt to equity, debt to assets, debt to capital, debt to EBITDA ratios. efficiency : inventory turnover, asset turnover, fixed asset turnover, receivable turnover, account payable turnover ratios . investment potential iii) Based on the ratio analyses, discuss Limitations of ratio analysis and; Any practical difficulties faced in the calculation of the ratios
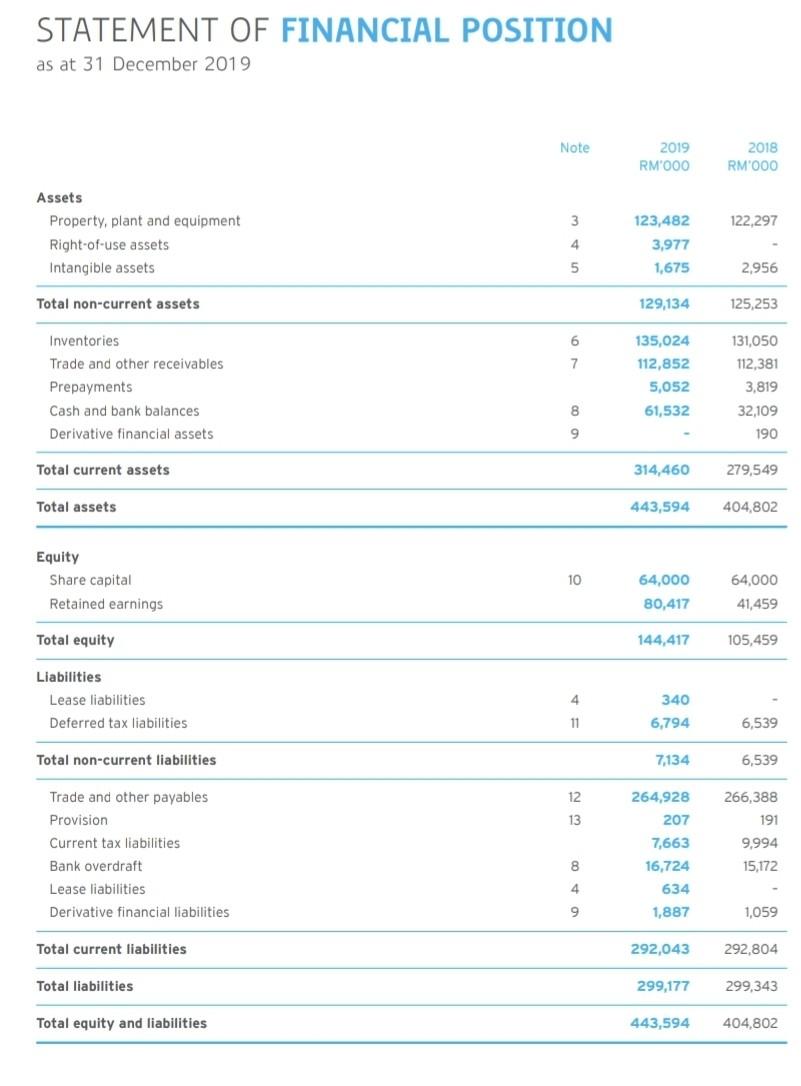
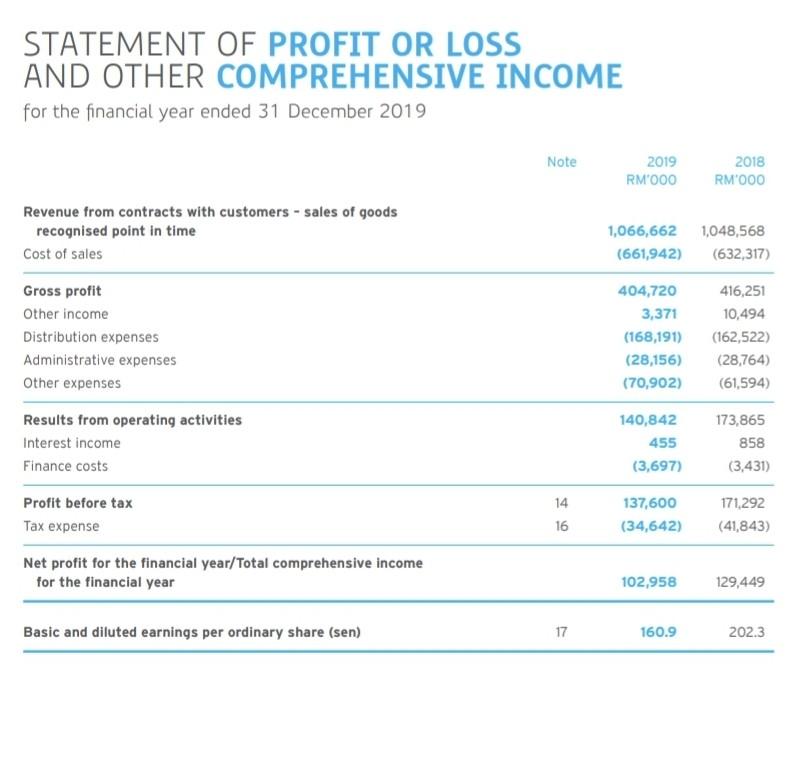
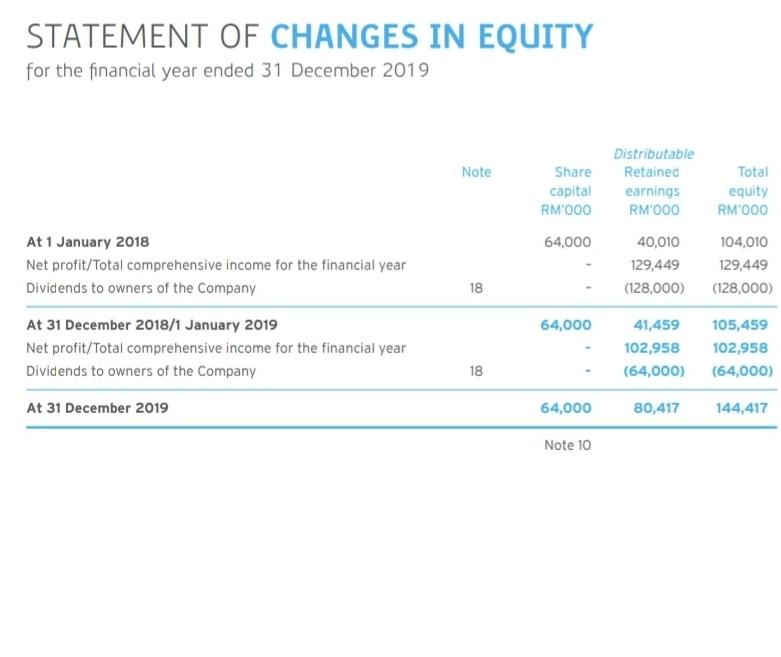
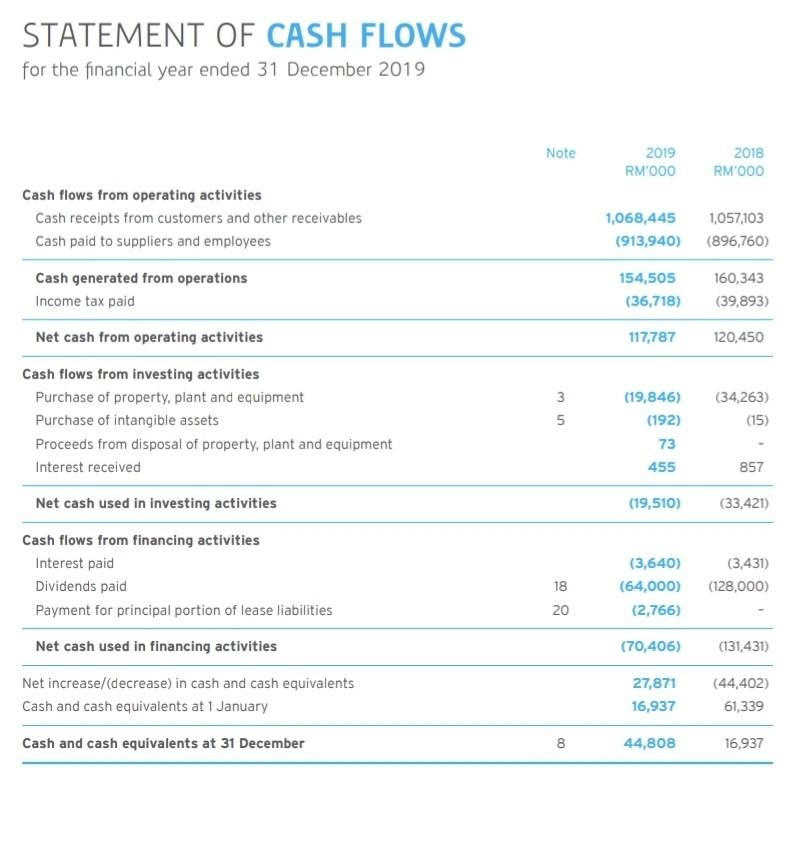
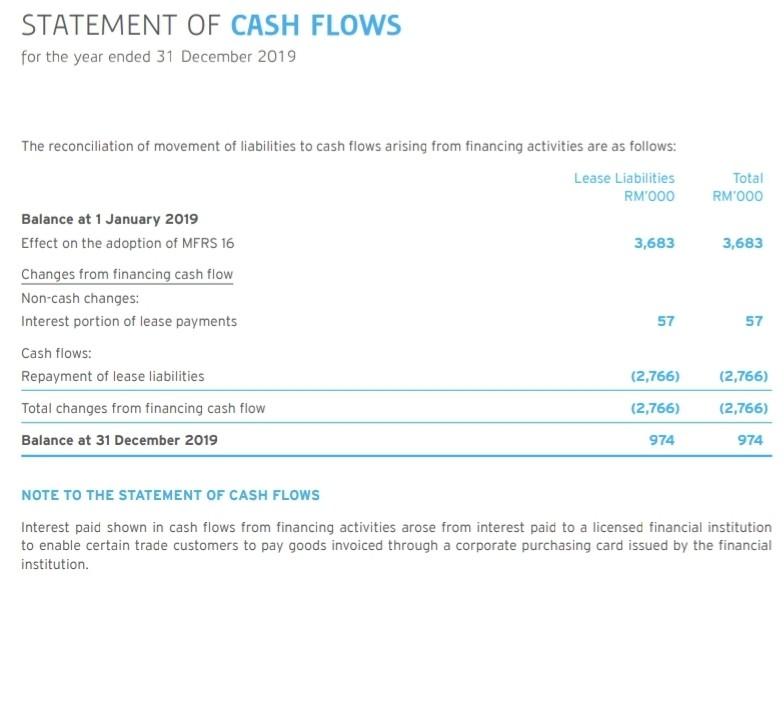
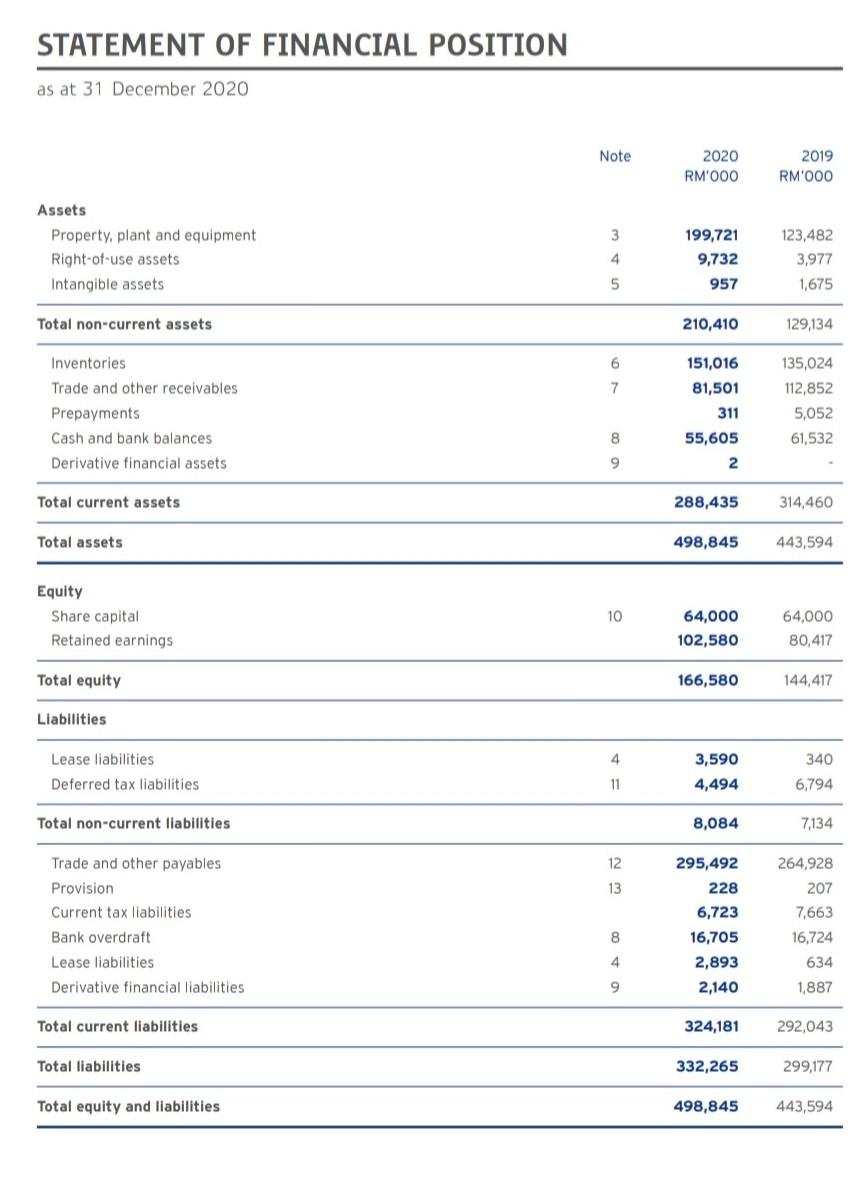
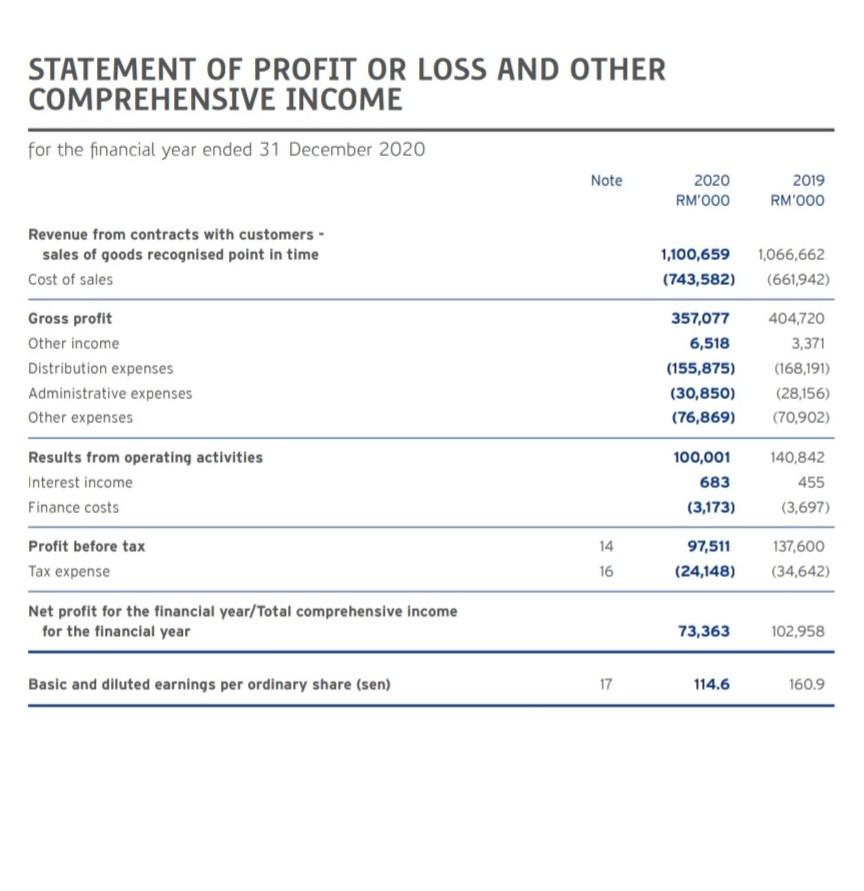
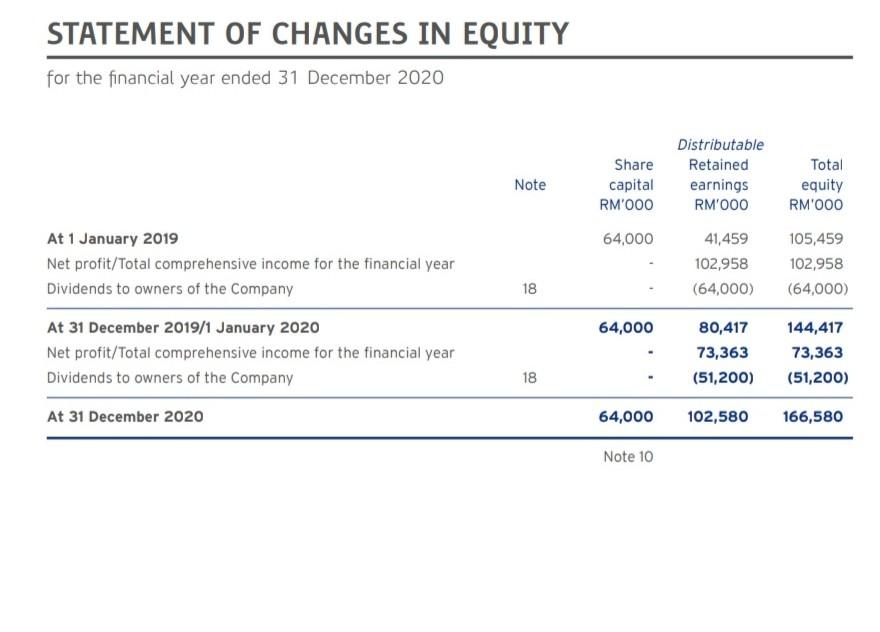
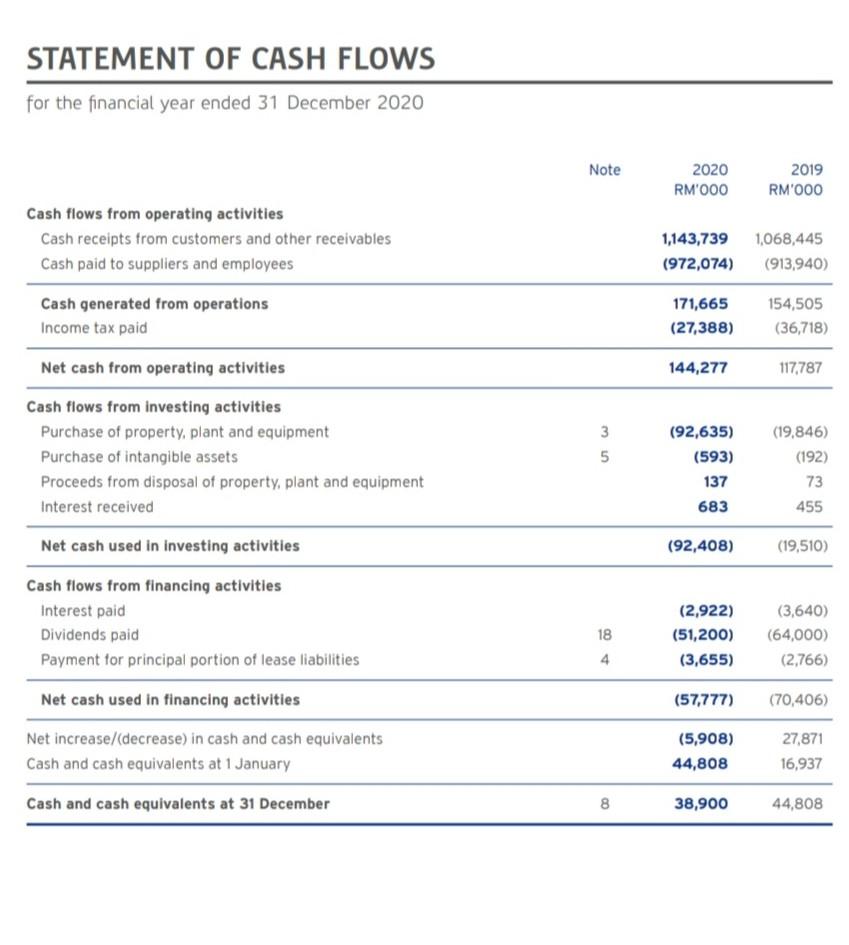
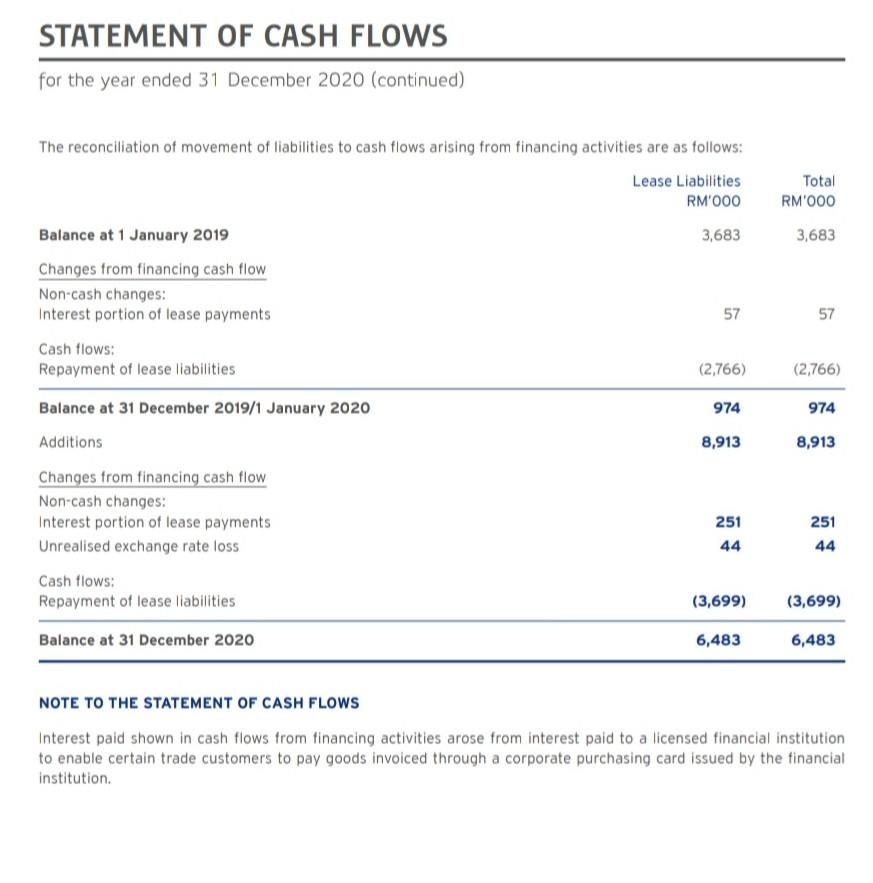
STATEMENT OF FINANCIAL POSITION as at 31 December 2019 Note 2019 RM'000 2018 RM'000 3 122,297 Assets Property, plant and equipment Right-of-use assets Intangible assets 4 123,482 3,977 1,675 5 2,956 Total non-current assets 129,134 125,253 6 7 Inventories Trade and other receivables Prepayments Cash and bank balances Derivative financial assets 135,024 112,852 5,052 61,532 131,050 112,381 3,819 8 32,109 190 9 Total current assets 314,460 279,549 Total assets 443,594 404,802 Equity Share capital Retained earnings 10 64,000 80,417 64,000 41,459 Total equity 144,417 105,459 Liabilities Lease liabilities Deferred tax liabilities 4 340 6,794 11 6,539 Total non-current liabilities 7,134 6,539 12 13 Trade and other payables Provision Current tax liabilities Bank overdraft Lease liabilities Derivative financial liabilities 264,928 207 7,663 16,724 634 1,887 266,388 191 9.994 15,172 8 4 9 1,059 Total current liabilities 292,043 292.804 Total liabilities 299,177 299,343 Total equity and liabilities 443,594 404,802 STATEMENT OF PROFIT OR LOSS AND OTHER COMPREHENSIVE INCOME for the financial year ended 31 December 2019 Note 2019 RM000 2018 RM'000 Revenue from contracts with customers - sales of goods recognised point in time Cost of sales 1,066,662 (661,942) 1,048,568 (632,317) Gross profit Other income Distribution expenses Administrative expenses Other expenses 404,720 3,371 (168,191) (28,156) (70,902) 416,251 10,494 (162,522) (28,764) (61,594) Results from operating activities Interest income Finance costs 140,842 455 (3,697) 173,865 858 (3,431) 14 16 137,600 (34,642) 171,292 (41,843) 6 Profit before tax Tax expense Net profit for the financial year/Total comprehensive income for the financial year 102,958 129,449 Basic and diluted earnings per ordinary share (sen) 17 160.9 202.3 STATEMENT OF CHANGES IN EQUITY for the financial year ended 31 December 2019 Note Share capital RM'000 Distributable Retained earnings RM'OOO Total equity RM'000 64,000 40,010 129,449 (128,000) 104,010 129,449 (128,000) 18 At 1 January 2018 Net profit/Total comprehensive income for the financial year Dividends to owners of the Company At 31 December 2018/1 January 2019 Net profit/Total comprehensive income for the financial year Dividends to owners of the Company 64,000 41,459 102,958 (64,000) 105,459 102,958 (64,000) 18 At 31 December 2019 64,000 80,417 144,417 Note 10 STATEMENT OF CASH FLOWS for the financial year ended 31 December 2019 Note 2019 RM'OOO 2018 RM'000 Cash flows from operating activities Cash receipts from customers and other receivables Cash paid to suppliers and employees Cash generated from operations Income tax paid 1,068,445 (913,940) 1,057,103 (896,760) 154,505 (36,718) 160,343 (39,893) Net cash from operating activities 117,787 120,450 3 5 (19,846) (192) (34,263) (15) Cash flows from investing activities Purchase of property, plant and equipment Purchase of intangible assets Proceeds from disposal of property, plant and equipment Interest received Net cash used in investing activities 73 455 857 (19,510) (33,421) Cash flows from financing activities Interest paid Dividends paid Payment for principal portion of lease liabilities (3,640) (64,000) (2,766) (3,431) (128,000) 18 20 (70,406) (131,431) Net cash used in financing activities Net increase/(decrease) in cash and cash equivalents Cash and cash equivalents at 1 January 27,871 16,937 (44,402) 61,339 Cash and cash equivalents at 31 December 8 8 44,808 16,937 STATEMENT OF CASH FLOWS for the year ended 31 December 2019 Total RM'000 3,683 The reconciliation of movement of liabilities to cash flows arising from financing activities are as follows: Lease Liabilities RM'OOO Balance at 1 January 2019 Effect on the adoption of MFRS 16 3,683 Changes from financing cash flow Non-cash changes: Interest portion of lease payments 57 Cash flows: Repayment of lease liabilities (2,766) Total changes from financing cash flow (2,766) Balance at 31 December 2019 974 57 (2,766) (2,766) 974 NOTE TO THE STATEMENT OF CASH FLOWS Interest paid shown in cash flows from financing activities arose from interest paid to a licensed financial institution to enable certain trade customers to pay goods invoiced through a corporate purchasing card issued by the financial institution. STATEMENT OF FINANCIAL POSITION as at 31 December 2020 Note 2020 RM'000 2019 RM'000 3 Assets Property, plant and equipment Right-of-use assets Intangible assets 199,721 9,732 4 123,482 3,977 1,675 5 957 Total non-current assets 210,410 129,134 6 7 Inventories Trade and other receivables Prepayments Cash and bank balances Derivative financial assets 151,016 81,501 311 135,024 112,852 5,052 61,532 8 55,605 2 Total current assets 288,435 314,460 Total assets 498,845 443,594 Equity Share capital Retained earnings 10 64,000 102,580 64,000 80,417 Total equity 166,580 144,417 Liabilities 4 340 Lease liabilities Deferred tax liabilities 3,590 4,494 11 6,794 Total non-current liabilities 8,084 7,134 12 13 Trade and other payables Provision Current tax liabilities Bank overdraft Lease liabilities Derivative financial liabilities 295,492 228 6,723 16,705 2,893 2,140 264,928 207 7,663 16,724 634 1,887 8 4. 9 Total current liabilities 324,181 292,043 Total liabilities 332,265 299,177 Total equity and liabilities 498,845 443,594 STATEMENT OF PROFIT OR LOSS AND OTHER COMPREHENSIVE INCOME for the financial year ended 31 December 2020 Note 2020 RM'OOO 2019 RM'OOO Revenue from contracts with customers - sales of goods recognised point in time Cost of sales 1,100,659 (743,582) 1,066,662 (661,942) Gross profit Other income Distribution expenses Administrative expenses Other expenses 357,077 6,518 (155,875) (30,850) (76,869) 404,720 3,371 (168,191) (28,156) (70,902) Results from operating activities Interest income Finance costs 100,001 683 (3,173) 140,842 455 (3,697) Profit before tax Tax expense 14 16 97,511 (24,148) 137,600 (34,642) Net profit for the financial year/Total comprehensive income for the financial year 73,363 102,958 Basic and diluted earnings per ordinary share (sen) 17 114.6 160.9 STATEMENT OF CHANGES IN EQUITY for the financial year ended 31 December 2020 Distributable Retained earnings RM'OOO Share capital RM'OOO Note Total equity RM'000 64,000 41,459 102,958 (64,000) 105,459 102,958 (64,000) 18 At 1 January 2019 Net profit/Total comprehensive income for the financial year Dividends to owners of the Company At 31 December 2019/1 January 2020 Net profit/Total comprehensive income for the financial year Dividends to owners of the Company 64,000 80,417 73,363 (51,200) 144,417 73,363 (51,200) 18 At 31 December 2020 64,000 102,580 166,580 Note 10 STATEMENT OF CASH FLOWS for the financial year ended 31 December 2020 Note 2020 RM'000 2019 RM'OOO Cash flows from operating activities Cash receipts from customers and other receivables Cash paid to suppliers and employees Cash generated from operations Income tax paid 1,143,739 (972,074) 1,068,445 (913,940) 171,665 (27,388) 154,505 (36,718) Net cash from operating activities 144,277 117,787 3 5 Cash flows from investing activities Purchase of property, plant and equipment Purchase of intangible assets Proceeds from disposal of property, plant and equipment Interest received Net cash used in investing activities (92,635) (593) 137 683 (19,846) (192) 73 455 (92,408) (19,510) Cash flows from financing activities Interest paid Dividends paid Payment for principal portion of lease liabilities 18 4. (2,922) (51,200) (3,655) (3,640) (64,000) (2,766) Net cash used in financing activities (57,777) (70,406) Net increase/(decrease) in cash and cash equivalents Cash and cash equivalents at 1 January (5,908) 44,808 27,871 16,937 Cash and cash equivalents at 31 December 8 38,900 44,808 STATEMENT OF CASH FLOWS for the year ended 31 December 2020 (continued) Total RM'OOO 3,683 The reconciliation of movement of liabilities to cash flows arising from financing activities are as follows: Lease Liabilities RM'OOO Balance at 1 January 2019 3,683 Changes from financing cash flow Non-cash changes: Interest portion of lease payments Cash flows: Repayment of lease liabilities (2,766) 57 57 (2,766) Balance at 31 December 2019/1 January 2020 974 974 Additions 8,913 8,913 Changes from financing cash flow Non-cash changes: Interest portion of lease payments Unrealised exchange rate loss Cash flows: Repayment of lease liabilities 251 44 251 44 (3,699) (3,699) Balance at 31 December 2020 6,483 6,483 NOTE TO THE STATEMENT OF CASH FLOWS Interest paid shown in cash flows from financing activities arose from interest paid to a licensed financial institution to enable certain trade customers to pay goods invoiced through a corporate purchasing card issued by the financial institution
Step by Step Solution
There are 3 Steps involved in it
Step: 1

Get Instant Access to Expert-Tailored Solutions
See step-by-step solutions with expert insights and AI powered tools for academic success
Step: 2

Step: 3

Ace Your Homework with AI
Get the answers you need in no time with our AI-driven, step-by-step assistance
Get Started


