

Answered step by step
Verified Expert Solution
Question
1 Approved Answer
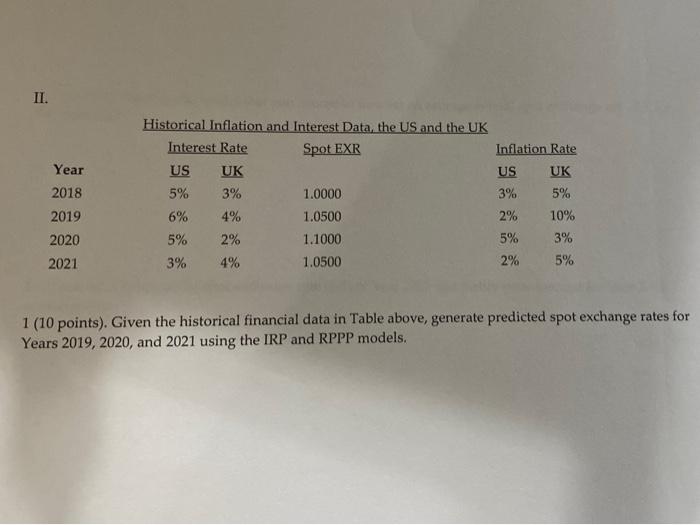
II. Year 2018 2019 Historical Inflation and Interest Data, the US and the UK Interest Rate Spot EXR US UK 5% 3% 1.0000 6% 4%
Step by Step Solution
There are 3 Steps involved in it
Step: 1

Get Instant Access to Expert-Tailored Solutions
See step-by-step solutions with expert insights and AI powered tools for academic success
Step: 2

Step: 3
Ace Your Homework with AI
Get the answers you need in no time with our AI-driven, step-by-step assistance
Get Started
Office Of Anticorruption And Integrity Annual Report 2023
Authors: Asian Development Bank
1st Edition
9292544381,929254439X