Answered step by step
Verified Expert Solution
Link Copied!

Question

1 Approved Answer

II.Examine the following graph and answer the questions below Net Present Value Profiles: NPVs of Projects S and L at Different Costs of Capital Net

II.Examine the following graph and answer the questions below
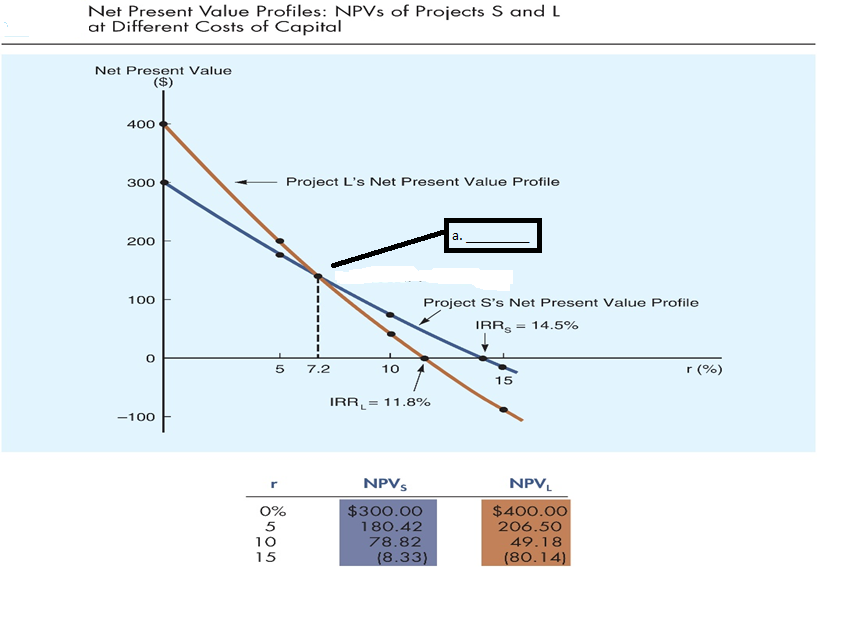
image text in transcribedimage text in transcribed
Net Present Value Profiles: NPVs of Projects S and L at Different Costs of Capital Net Present Value ($) 400 300 Project L's Net Present Value Profile 200 a. 100 Project S's Net Present Value Profile IRR = 14.5% O 5 7.2 10 15 r (%) IRR, = 11.8% -100 r NPV S NPVL 0% $300.00 $400.00 5 180.42 206.50 10 78.82 49.18 15 (8.33) (80.14)\f

Step by Step Solution

There are 3 Steps involved in it

Step: 1

blur-text-image

Get Instant Access to Expert-Tailored Solutions

See step-by-step solutions with expert insights and AI powered tools for academic success

Step: 2

blur-text-image

Step: 3

blur-text-image

Ace Your Homework with AI

Get the answers you need in no time with our AI-driven, step-by-step assistance

Get Started

Recommended Textbook for

Transport Operations

Authors: Allen Stuart

2nd Edition

978-0470115398, 0470115394

More Books

Students also viewed these General Management questions

Question

Who was the confederate president during the civil war ?

Answered: 1 week ago

Question

The emancipation proclamation issued?

Answered: 1 week ago

Question

What war was declared by James Madison ?

Answered: 1 week ago

Question

Americas first sub way system open ?

Answered: 1 week ago

Question

Which was the first president not to own slaves ?

Answered: 1 week ago