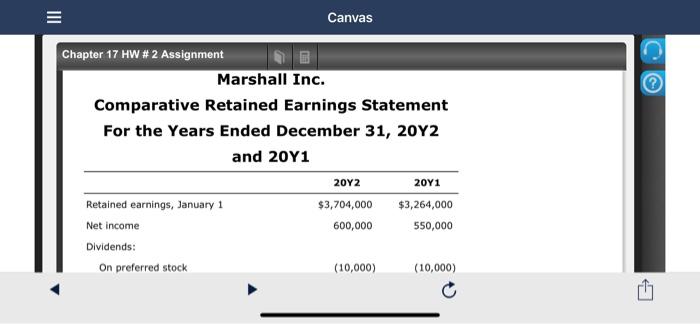
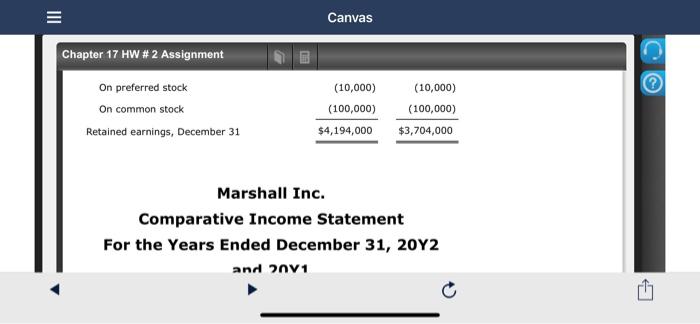
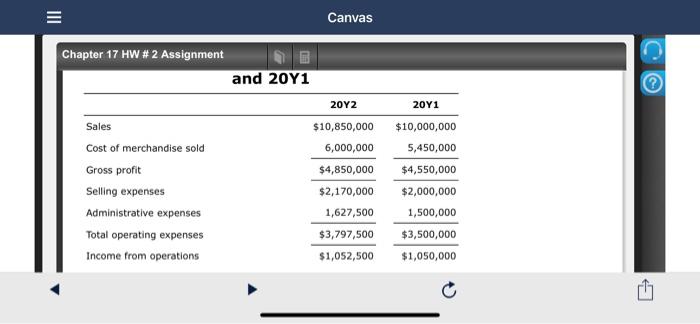
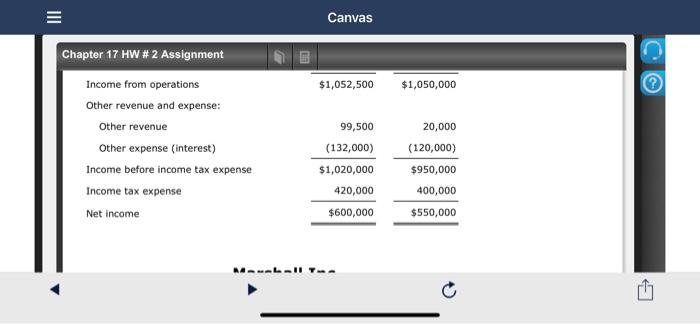
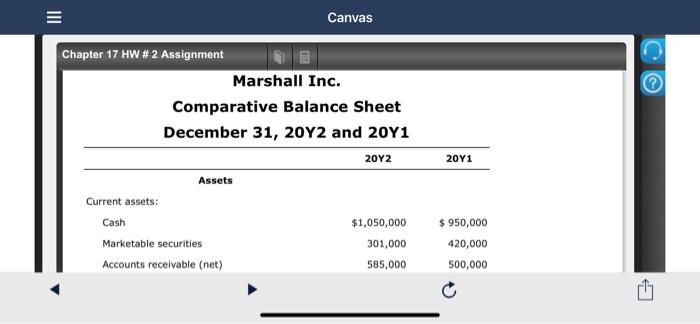
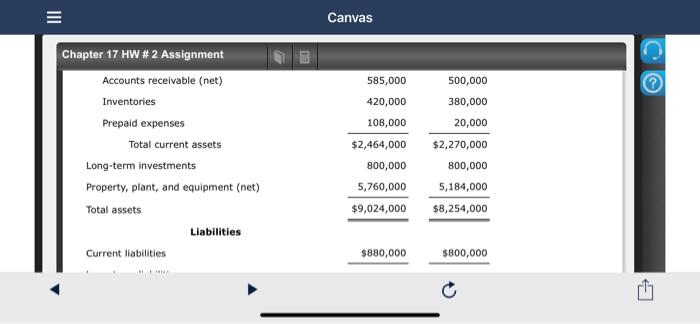
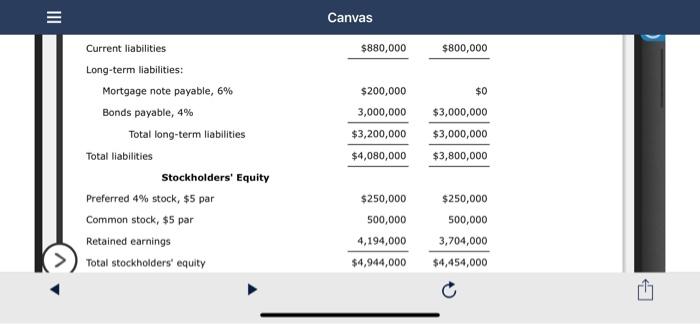
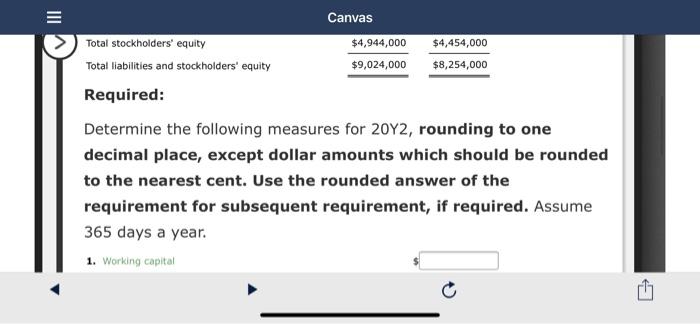
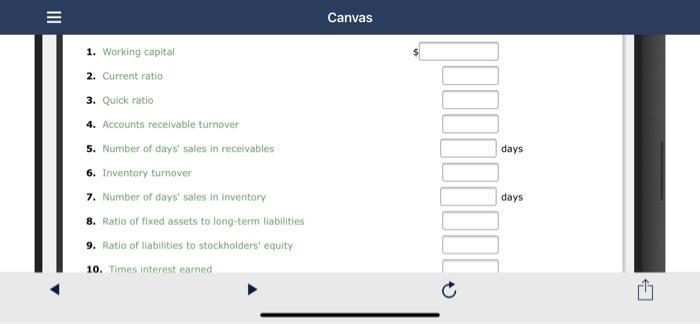
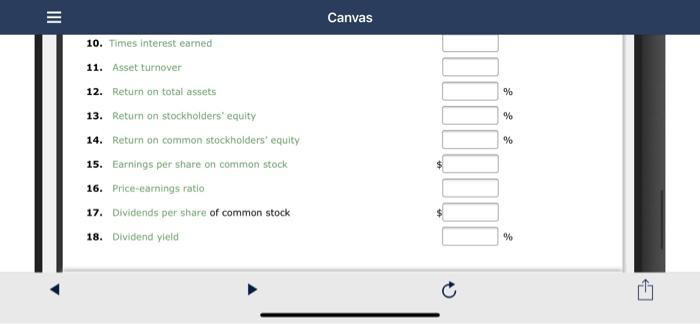
III Canvas Chapter 17 HW # 2 Assignment @ Measures of liquidity, Solvency, and Profitability The comparative financial statements of Marshall Inc. are as follows. The market price of Marshall common stock was $82.60 on December 31, 2012. Marshall Inc. Comparative Retained Earnings Statement For the Years Ended December 31, 20Y2 1 Canvas Chapter 17 HW # 2 Assignment Marshall Inc. Comparative Retained Earnings Statement For the Years Ended December 31, 20Y2 and 2041 2012 20Y1 Retained earnings, January 1 $3,704,000 $3,264,000 550,000 Dividends: On preferred stock (10,000) (10,000) Net income 600,000 III Canvas Chapter 17 HW # 2 Assignment On preferred stock On common stock Retained earnings, December 31 (10,000) (100,000) $4,194,000 (10,000) (100,000) $3,704,000 Marshall Inc. Comparative Income Statement For the Years Ended December 31, 2012 and 2011 III Canvas Chapter 17 HW # 2 Assignment Sales Cost of merchandise sold Gross profit Selling expenses Administrative expenses Total operating expenses Income from operations and 20Y1 2012 $10,850,000 6,000,000 $4,850,000 $2,170,000 1,627,500 $3,797,500 2011 $10,000,000 5,450,000 $4,550,000 $2,000,000 1,500,000 $3,500,000 $1,052,500 $1,050,000 III Canvas $1,052,500 $1,050,000 Chapter 17 HW # 2 Assignment Income from operations Other revenue and expense: Other revenue Other expense interest) Income before income tax expense Income tax expense Net income 99,500 (132,000) $1,020,000 420,000 $600,000 20,000 (120,000) $950,000 400,000 $550,000 LIIT. III Canvas Chapter 17 HW # 2 Assignment Marshall Inc. Comparative Balance Sheet December 31, 20Y2 and 2041 2042 Assets 2011 Current assets: Cash Marketable securities Accounts receivable (net) $1,050,000 301,000 585,000 $ 950,000 420,000 500,000 III Canvas Chapter 17 HW # 2 Assignment Accounts receivable (net) Inventories Prepaid expenses Total current assets Long-term investments Property, plant, and equipment (net) Total assets Liabilities 585,000 420,000 108,000 $2,464,000 800,000 5,760,000 $9,024,000 500,000 380,000 20,000 $2,270,000 800,000 5,184,000 $8,254,000 Current liabilities $880,000 $800,000 Canvas $880,000 $800,000 Current liabilities Long-term liabilities: Mortgage note payable, 6% Bonds payable, 4% Total long-term liabilities Total liabilities Stockholders' Equity Preferred 4% stock, $5 par Common stock, $5 par Retained earnings Total stockholders' equity $200,000 3,000,000 $3,200,000 $4,080,000 $0 $3,000,000 $3,000,000 $3,800,000 $250,000 500,000 4,194,000 $4,944,000 $250,000 500,000 3,704,000 $4,454,000 Canvas Total stockholders' equity $4,944,000 $4,454,000 Total liabilities and stockholders' equity $9,024,000 $8,254,000 Required: Determine the following measures for 20Y2, rounding to one decimal place, except dollar amounts which should be rounded to the nearest cent. Use the rounded answer of the requirement for subsequent requirement, if required. Assume 365 days a year. 1. Working capital Canvas 1. Working capital 2. Current ratio days 3. Quick ratio 4. Accounts receivable turnover 5. Number of days' sales in receivables 6. Inventory turnover 7. Number of days sales in inventory 8. Ratio of fixed assets to long-term liabilities 9. Ratio of liabilities to stockholders' equity 10. Times interest earned days Canvas 10. Times interest earned 11. Asset turnover % % % 12. Return on total assets 13. Return on stockholders' equity 14. Return on common stockholders' equity 15. Earnings per share on common stock 16. Price-earnings ratio 17. Dividends per share of common stock 18. Dividend yield %