

Question: il L9 E =Y 2] ~ You are a statistician contracted to sample and analyze weights of the 5 |b bags of coffee. You collect
![il L9 E =Y 2] ~ You are a statistician contracted](https://dsd5zvtm8ll6.cloudfront.net/si.experts.images/questions/2024/10/670841a8f2285_344670841a8dd499.jpg)
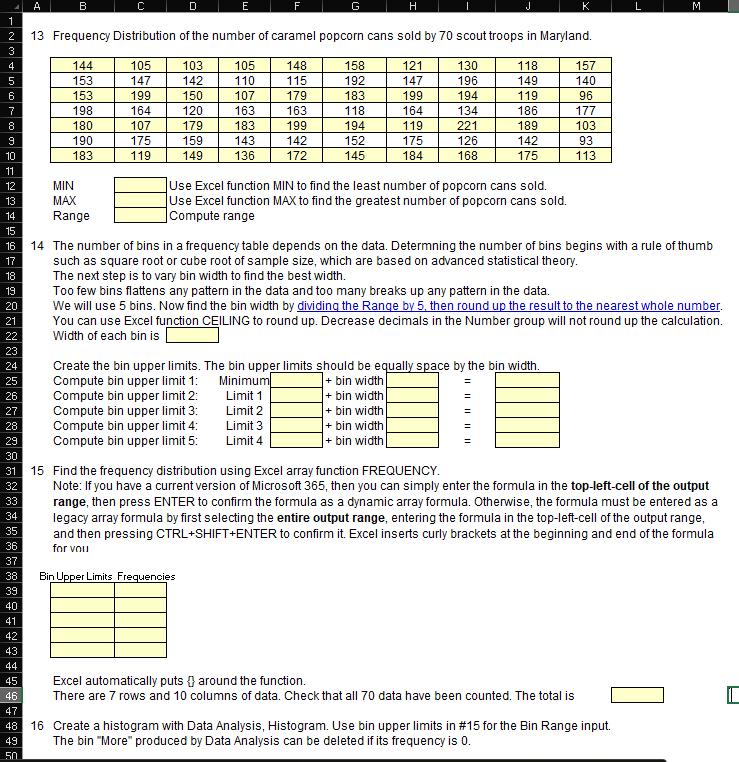
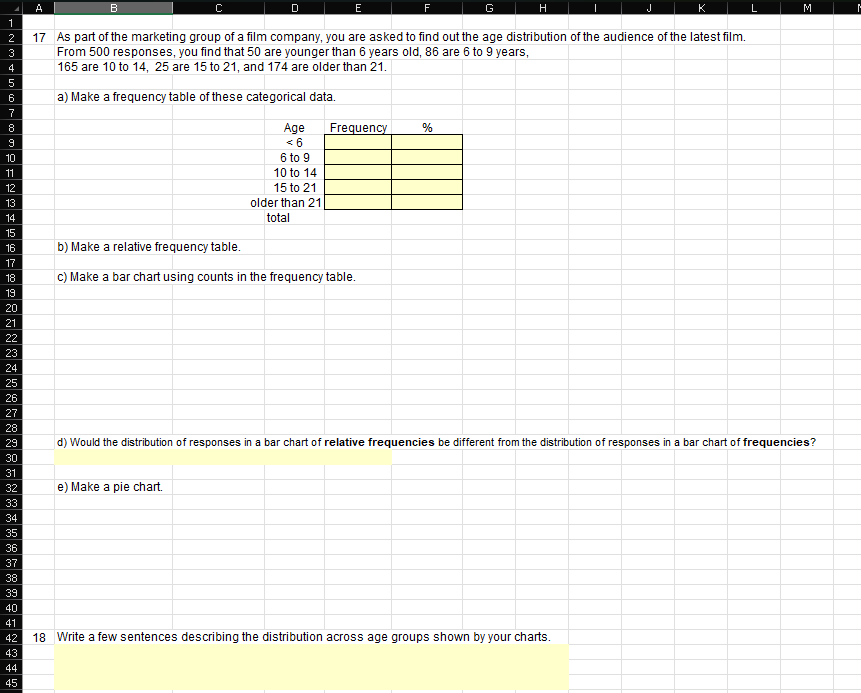
il L9 E =Y 2] ~ You are a statistician contracted to sample and analyze weights of the 5 |b bags of coffee. You collect the following 515 4.83 4.22 5.51 4.29 4.72 5.26 4.99 Compute the following coffee bag statistics using individual Excel functions (not Data Analysis, Descriptive Statistics): 5.03 4.92 3.70 6.05 3.60 4.58 4.80 524 Mean Median 5.10 476 505 4T 5.48 4.55 5.64 4.77 501 504 463 441 487 460 5.63 530 460 523 5.73 4.98 5.55 510 432 429 454 5.57 4.54 5.13 510 492 477 463 441 487 460 5.64 5056 536 561 5.95 4.63 4.41 3.87 503 544 598 541 4.80 4.99 4.28 584 501 3.87 548 4.46 4.59 4.927 4.917 5.05 474 4.9 476 5.23 4.79 51 4.57 2 There are several ways to calculate quartiles that result in different answers. QUARTILE and QUARTILE INC can produce a result that is not in the dataset or an unexpected result if you have a dataset with an even number of values. Third guartile @3 using QUARTILE.EXC First gquartile Q1 using QUARTILE EXC Interquartile range (IQR) Maximum Minimum Range 4 For the standard deviation. when Use STDEV.S for a sample of the population. Use STDEV.P for the entire population. Coeficient of Variation % (CV) Variance Standard deviation 5.237533059 4.595 0.642 6.049 3.600 2.449 do you use STDEV.S and when do you use STDEV.P? 0.259 0.509 u 6 The unit of physical measure associated with the standard deviation is the same as unit of data. When calculating variance, the u nit is squared. When data is in inches, variance is in inches squared. Would you scale graphs and histograms in increments of variance or standard deviation? 44 Explain why the standard deviation is more useful than the variance in scaling data. 45 46 47 48 7 As a contracted statistician, you have no prior knowledge of the company's coffee product, 49 and the company has no prior statistics with which to assess the current data. Explain 50 to the manufacture why there is or is not a concern with average bag weight comparing 51 your mean or median statistics to the nominal bag weight of 5 Ibs. 52 53 54 55 56 8 What are two situations where the CV is especially useful (Week 2 Presentation slide 13)? 57 58 59 60 61 Again, explain to the manufacturer why there is or is not a concern with the variability of the product 62 using the appropriate coffee bag weight statistic. 63 64 65 66N N 13 Frequency Distribution of the number of caramel popcorn cans sold by 70 scout troops in Maryland. 144 105 103 105 148 158 121 130 118 157 153 147 142 110 115 192 147 196 149 140 153 199 150 107 179 183 199 194 119 96 198 164 120 163 163 118 164 134 186 177 180 107 179 183 199 194 119 221 189 103 190 175 159 143 142 152 175 126 142 93 183 119 149 136 172 145 184 168 175 113 MIN Use Excel function MIN to find the least number of popcorn cans sold. MAX Use Excel function MAX to find the greatest number of popcorn cans sold. Range Compute range 14 The number of bins in a frequency table depends on the data. Determning the number of bins begins with a rule of thumb such as square root or cube root of sample size, which are based on advanced statistical theory. The next step is to vary bin width to find the best width. Too few bins flattens any pattern in the data and too many breaks up any pattern in the data. We will use 5 bins. Now find the bin width by dividing the Range by 5, then round up the result to the nearest whole number. You can use Excel function CEILING to round up. Decrease decimals in the Number group will not round up the calculation. Width of each bin is Create the bin upper limits. The bin upper limits should be equally space by the bin width Compute bin upper limit 1: Minimum + bin width Compute bin upper limit 2: Limit 1 + bin width Compute bin upper limit 3: Limit 2 + bin width Compute bin upper limit 4: Limit 3 + bin width Compute bin upper limit 5: Limit 4 + bin width 15 Find the frequency distribution using Excel array function FREQUENCY. Note: If you have a current version of Microsoft 365, then you can simply enter the formula in the top-left-cell of the output range, then press ENTER to confirm the formula as a dynamic array formula. Otherwise, the formula must be entered as a legacy array formula by first selecting the entire output range, entering the formula in the top-left-cell of the output range, and then pressing CTRL+SHIFT+ENTER to confirm it. Excel inserts curly brackets at the beginning and end of the formula for vou Bin Upper Limits Frequencies 39 40 41 42 43 44 45 Excel automatically puts $ around the function. 46 There are 7 rows and 10 columns of data. Check that all 70 data have been counted. The total is 47 48 16 Create a histogram with Data Analysis, Histogram. Use bin upper limits in #15 for the Bin Range input. 49 The bin "More" produced by Data Analysis can be deleted if its frequency is 0.M A B C D E G H 17 As part of the marketing group of a film company, you are asked to find out the age distribution of the audience of the latest film. From 500 responses, you find that 50 are younger than 6 years old, 86 are 6 to 9 years, 165 are 10 to 14, 25 are 15 to 21, and 174 are older than 21. a) Make a frequency table of these categorical data. 8 Age Frequency
Step by Step Solution
There are 3 Steps involved in it

Get step-by-step solutions from verified subject matter experts