

Question
Illustrate the inputs needed for WACC calculation, including estimation of the cost of equity and debt. Estimate the beta, cost of equity, and WACC for
Illustrate the inputs needed for WACC calculation, including estimation of the cost of equity and debt.
Estimate the beta, cost of equity, and WACC for TTK Prestige.
Calculate the NOPAT and cost of capital employed (COCE) for TTK Prestige over the past five years to arrive at EVA analysis.
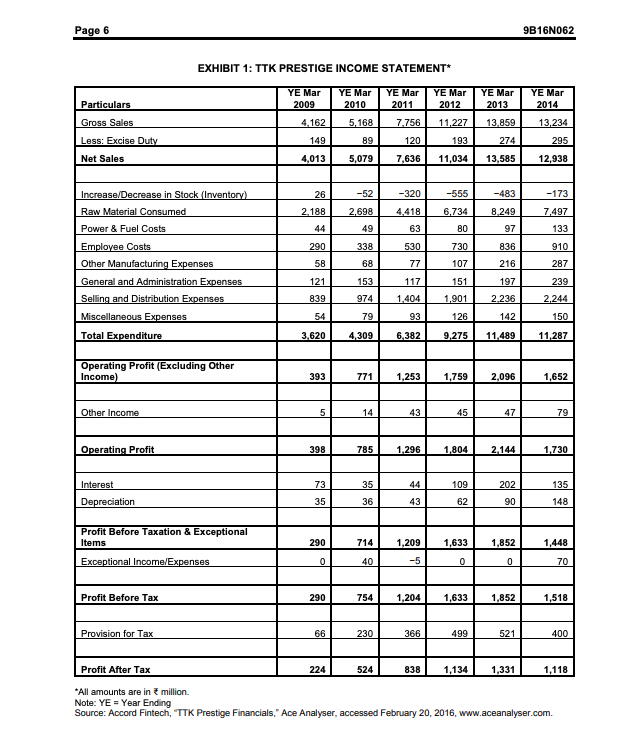
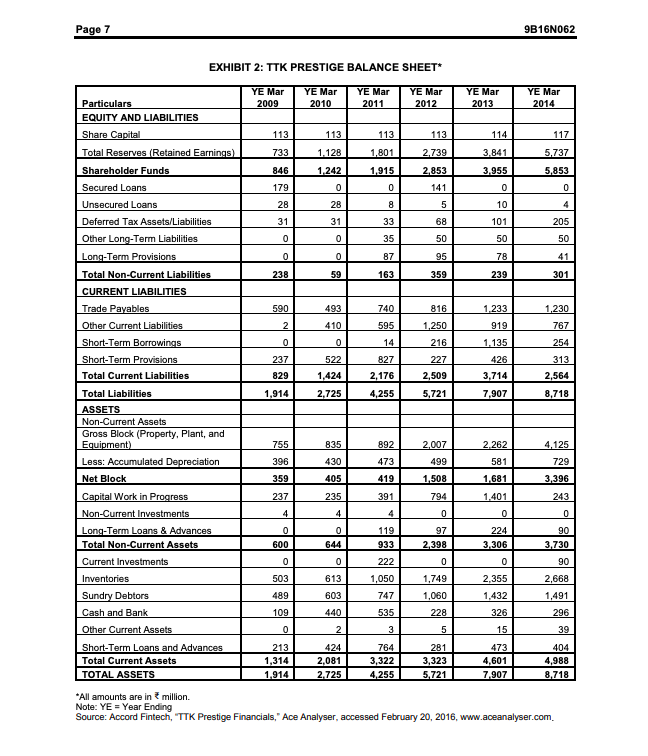
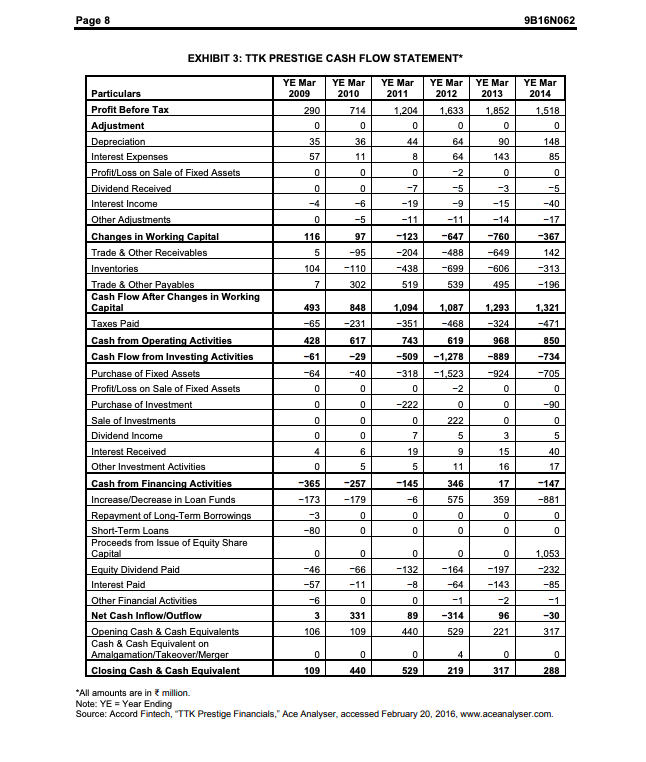
Page 6 9B16NO62 EXHIBIT 1: TTK PRESTIGE INCOME STATEMENT YE Mar 2009 YE Mar 2010 YE Mar 2011 YE Mar 2012 YE Mar 2013 YE Mar 2014 4,162 7,756 11,227 13.859 Particulars Gross Sales Less: Excise Duty Net Sales 5,168 89 13,234 295 193 149 4,013 120 7,636 274 13,585 5,079 11,034 12,938 26 -52 -320 -555 -483 -173 2,698 4,418 7.497 6,734 80 8.249 97 49 63 133 2.188 44 290 58 530 730 Increase/Decrease in Stock (Inventory) Raw Material Consumed Power & Fuel Costs Employee Costs Other Manufacturing Expenses General and Administration Expenses Selling and Distribution Expenses Miscellaneous Expenses Total Expenditure 836 338 68 910 287 77 107 216 153 117 151 197 239 121 839 54 974 1.404 1,901 2.236 2.244 150 79 93 126 142 3.620 4,309 6.382 9,275 11.489 11,287 Operating Profit (Excluding Other Income) 393 771 1,253 1,759 2,096 1,652 Other Income 5 14 43 45 47 79 Operating Profit 398 785 1.296 1,804 2 144 1.730 73 35 202 Interest Depreciation 109 62 135 148 35 36 43 90 Profit Before Taxation & Exceptional Items 290 714 1,209 1,633 1,852 1,448 Exceptional Income/Expenses 0 40 -5 0 0 70 Profit Before Tax 290 754 1,204 1,633 1,852 1,518 Provision for Tax 66 230 366 499 521 400 Profit After Tax 224 524 838 1,134 1,331 1,118 *All amounts are in million. Note: YE = Year Ending Source: Accord Fintech, "TTK Prestige Financials, Ace Analyser, accessed February 20, 2016, www.aceanalyser.com. Page 7 9B16N062 EXHIBIT 2: TTK PRESTIGE BALANCE SHEET YE Mar 2009 YE Mar 2010 YE Mar 2011 YE Mar 2012 YE Mar 2013 YE Mar 2014 113 113 113 114 117 733 1.128 113 1,801 1.915 3,841 2.739 2,853 5.737 5,853 846 1.242 3,955 179 0 0 141 0 0 28 8 5 10 28 31 31 68 101 205 Particulars EQUITY AND LIABILITIES Share Capital Total Reserves (Retained Earnings) Shareholder Funds Secured Loans Unsecured Loans Deferred Tax Assets/Liabilities Other Long-Term Liabilities Long-Term Provisions Total Non-Current Liabilities CURRENT LIABILITIES Trade Payables Other Current Liabilities Short-Term Borrowings Short-Term Provisions Total Current Liabilities 0 0 33 35 87 50 50 0 0 50 78 239 95 359 41 238 59 163 301 590 493 410 740 595 816 1,250 1,233 919 1,135 1.230 767 2 216 0 237 829 0 522 426 14 827 2,176 4,255 254 313 2,564 8,718 227 2,509 5,721 1,424 2,725 3,714 7,907 Total Liabilities 1,914 755 2.007 835 430 892 473 419 4,125 729 396 499 2.262 581 1,681 1.401 359 1,508 3,396 405 235 237 391 243 794 0 4 4 4 0 0 119 ASSETS Non-Current Assets Gross Block (Property, Plant, and Equipment) Less: Accumulated Depreciation Net Block Capital Work in Progress Non-Current Investments Long-Term Loans & Advances Total Non-Current Assets Current Investments Inventories Sundry Debtors Cash and Bank Other Current Assets Short-Term Loans and Advances Total Current Assets TOTAL ASSETS 0 600 0 644 97 2.398 224 3.306 0 90 3.730 0 933 222 1,050 0 0 90 503 613 2.668 2,355 1.432 489 603 1,749 1,060 228 747 1.491 440 535 326 296 109 0 2 3 5 15 39 424 213 1,314 1.914 2,081 2.725 764 3,322 4,255 281 3,323 5,721 473 4,601 7.907 404 4,988 8,718 *All amounts are in million. Note: YE-Year Ending Source: Accord Fintech, "TTK Prestige Financials, Ace Analyser, accessed February 20, 2016, www.aceanalyser.com Page 8 9B16N062 EXHIBIT 3: TTK PRESTIGE CASH FLOW STATEMENT YE Mar 2009 YE Mar 2010 714 YE Mar 2013 YE Mar 2014 YE Mar 2011 1,204 0 YE Mar 2012 1,633 0 290 1.852 0 1,518 0 0 0 35 36 44 90 148 85 57 8 143 11 0 -2 0 0 0 -4 0 -6 0 -7 -19 -11 -5 -9 0 -3 -15 -5 -40 0 -5 -14 -17 116 -367 97 -95 -11 -647 -488 -699 -760 -649 5 -123 -204 -438 519 142 104 - 110 -606 -313 -196 7 302 539 495 493 848 1,094 1,321 1,087 -468 1,293 -324 -65 -231 -351 -471 428 617 743 619 968 850 -61 -29 -509 Particulars Profit Before Tax Adjustment Depreciation Interest Expenses Profit/Loss on Sale of Fixed Assets Dividend Received Interest Income Other Adjustments Changes in Working Capital Trade & Other Receivables Inventories Trade & Other Payables Cash Flow After Changes in Working Capital Taxes Paid Cash from Operating Activities Cash Flow from Investing Activities Purchase of Fixed Assets Profit/Loss on Sale of Fixed Assets Purchase of Investment Sale of Investments Dividend Income Interest Received Other Investment Activities Cash from Financing Activities Increase/Decrease in Loan Funds Repayment of Long-Term Borrowings Short-Term Loans Proceeds from Issue of Equity Share Capital Equity Dividend Paid Interest Paid Other Financial Activities Net Cash Inflow/Outflow Opening Cash & Cash Equivalents Cash & Cash Equivalent on Amalgamation/Takeover/Merger Closing Cash & Cash Equivalent -64 0 -40 0 -318 0 -1,278 -1.523 -2 -889 -924 0 -734 -705 0 0 -222 0 0 -90 0 0 0 0 222 0 0 0 0 7 5 3 5 4 6 40 19 5 9 11 15 16 0 5 17 -145 -365 -173 -257 -179 346 575 0 17 359 -147 -881 0 0 0 0 -3 -80 0 0 0 0 0 0 0 0 0 0 -164 -46 -57 -6 -132 -8 1.053 -232 -85 -64 -66 -11 0 331 -197 -143 -2 -1 0 89 440 -1 -30 3 96 -314 529 106 109 221 317 0 109 0 440 0 529 4 219 0 317 0 288 *All amounts are in million. Note: YE - Year Ending Source: Accord Fintech, "TTK Prestige Financials, Ace Analyser, accessed February 20, 2016, www.aceanalyser.com. Page 6 9B16NO62 EXHIBIT 1: TTK PRESTIGE INCOME STATEMENT YE Mar 2009 YE Mar 2010 YE Mar 2011 YE Mar 2012 YE Mar 2013 YE Mar 2014 4,162 7,756 11,227 13.859 Particulars Gross Sales Less: Excise Duty Net Sales 5,168 89 13,234 295 193 149 4,013 120 7,636 274 13,585 5,079 11,034 12,938 26 -52 -320 -555 -483 -173 2,698 4,418 7.497 6,734 80 8.249 97 49 63 133 2.188 44 290 58 530 730 Increase/Decrease in Stock (Inventory) Raw Material Consumed Power & Fuel Costs Employee Costs Other Manufacturing Expenses General and Administration Expenses Selling and Distribution Expenses Miscellaneous Expenses Total Expenditure 836 338 68 910 287 77 107 216 153 117 151 197 239 121 839 54 974 1.404 1,901 2.236 2.244 150 79 93 126 142 3.620 4,309 6.382 9,275 11.489 11,287 Operating Profit (Excluding Other Income) 393 771 1,253 1,759 2,096 1,652 Other Income 5 14 43 45 47 79 Operating Profit 398 785 1.296 1,804 2 144 1.730 73 35 202 Interest Depreciation 109 62 135 148 35 36 43 90 Profit Before Taxation & Exceptional Items 290 714 1,209 1,633 1,852 1,448 Exceptional Income/Expenses 0 40 -5 0 0 70 Profit Before Tax 290 754 1,204 1,633 1,852 1,518 Provision for Tax 66 230 366 499 521 400 Profit After Tax 224 524 838 1,134 1,331 1,118 *All amounts are in million. Note: YE = Year Ending Source: Accord Fintech, "TTK Prestige Financials, Ace Analyser, accessed February 20, 2016, www.aceanalyser.com. Page 7 9B16N062 EXHIBIT 2: TTK PRESTIGE BALANCE SHEET YE Mar 2009 YE Mar 2010 YE Mar 2011 YE Mar 2012 YE Mar 2013 YE Mar 2014 113 113 113 114 117 733 1.128 113 1,801 1.915 3,841 2.739 2,853 5.737 5,853 846 1.242 3,955 179 0 0 141 0 0 28 8 5 10 28 31 31 68 101 205 Particulars EQUITY AND LIABILITIES Share Capital Total Reserves (Retained Earnings) Shareholder Funds Secured Loans Unsecured Loans Deferred Tax Assets/Liabilities Other Long-Term Liabilities Long-Term Provisions Total Non-Current Liabilities CURRENT LIABILITIES Trade Payables Other Current Liabilities Short-Term Borrowings Short-Term Provisions Total Current Liabilities 0 0 33 35 87 50 50 0 0 50 78 239 95 359 41 238 59 163 301 590 493 410 740 595 816 1,250 1,233 919 1,135 1.230 767 2 216 0 237 829 0 522 426 14 827 2,176 4,255 254 313 2,564 8,718 227 2,509 5,721 1,424 2,725 3,714 7,907 Total Liabilities 1,914 755 2.007 835 430 892 473 419 4,125 729 396 499 2.262 581 1,681 1.401 359 1,508 3,396 405 235 237 391 243 794 0 4 4 4 0 0 119 ASSETS Non-Current Assets Gross Block (Property, Plant, and Equipment) Less: Accumulated Depreciation Net Block Capital Work in Progress Non-Current Investments Long-Term Loans & Advances Total Non-Current Assets Current Investments Inventories Sundry Debtors Cash and Bank Other Current Assets Short-Term Loans and Advances Total Current Assets TOTAL ASSETS 0 600 0 644 97 2.398 224 3.306 0 90 3.730 0 933 222 1,050 0 0 90 503 613 2.668 2,355 1.432 489 603 1,749 1,060 228 747 1.491 440 535 326 296 109 0 2 3 5 15 39 424 213 1,314 1.914 2,081 2.725 764 3,322 4,255 281 3,323 5,721 473 4,601 7.907 404 4,988 8,718 *All amounts are in million. Note: YE-Year Ending Source: Accord Fintech, "TTK Prestige Financials, Ace Analyser, accessed February 20, 2016, www.aceanalyser.com Page 8 9B16N062 EXHIBIT 3: TTK PRESTIGE CASH FLOW STATEMENT YE Mar 2009 YE Mar 2010 714 YE Mar 2013 YE Mar 2014 YE Mar 2011 1,204 0 YE Mar 2012 1,633 0 290 1.852 0 1,518 0 0 0 35 36 44 90 148 85 57 8 143 11 0 -2 0 0 0 -4 0 -6 0 -7 -19 -11 -5 -9 0 -3 -15 -5 -40 0 -5 -14 -17 116 -367 97 -95 -11 -647 -488 -699 -760 -649 5 -123 -204 -438 519 142 104 - 110 -606 -313 -196 7 302 539 495 493 848 1,094 1,321 1,087 -468 1,293 -324 -65 -231 -351 -471 428 617 743 619 968 850 -61 -29 -509 Particulars Profit Before Tax Adjustment Depreciation Interest Expenses Profit/Loss on Sale of Fixed Assets Dividend Received Interest Income Other Adjustments Changes in Working Capital Trade & Other Receivables Inventories Trade & Other Payables Cash Flow After Changes in Working Capital Taxes Paid Cash from Operating Activities Cash Flow from Investing Activities Purchase of Fixed Assets Profit/Loss on Sale of Fixed Assets Purchase of Investment Sale of Investments Dividend Income Interest Received Other Investment Activities Cash from Financing Activities Increase/Decrease in Loan Funds Repayment of Long-Term Borrowings Short-Term Loans Proceeds from Issue of Equity Share Capital Equity Dividend Paid Interest Paid Other Financial Activities Net Cash Inflow/Outflow Opening Cash & Cash Equivalents Cash & Cash Equivalent on Amalgamation/Takeover/Merger Closing Cash & Cash Equivalent -64 0 -40 0 -318 0 -1,278 -1.523 -2 -889 -924 0 -734 -705 0 0 -222 0 0 -90 0 0 0 0 222 0 0 0 0 7 5 3 5 4 6 40 19 5 9 11 15 16 0 5 17 -145 -365 -173 -257 -179 346 575 0 17 359 -147 -881 0 0 0 0 -3 -80 0 0 0 0 0 0 0 0 0 0 -164 -46 -57 -6 -132 -8 1.053 -232 -85 -64 -66 -11 0 331 -197 -143 -2 -1 0 89 440 -1 -30 3 96 -314 529 106 109 221 317 0 109 0 440 0 529 4 219 0 317 0 288 *All amounts are in million. Note: YE - Year Ending Source: Accord Fintech, "TTK Prestige Financials, Ace Analyser, accessed February 20, 2016, www.aceanalyser.comStep by Step Solution
There are 3 Steps involved in it
Step: 1

Get Instant Access to Expert-Tailored Solutions
See step-by-step solutions with expert insights and AI powered tools for academic success
Step: 2

Step: 3
Ace Your Homework with AI
Get the answers you need in no time with our AI-driven, step-by-step assistance
Get Started
Financial Statements The Ultimate Guide To Financial Statements Analysis For Business Owners And Investors
Authors: Greg Shields
1st Edition
172643320X, 978-1726433204