Answered step by step
Verified Expert Solution
Question
1 Approved Answer
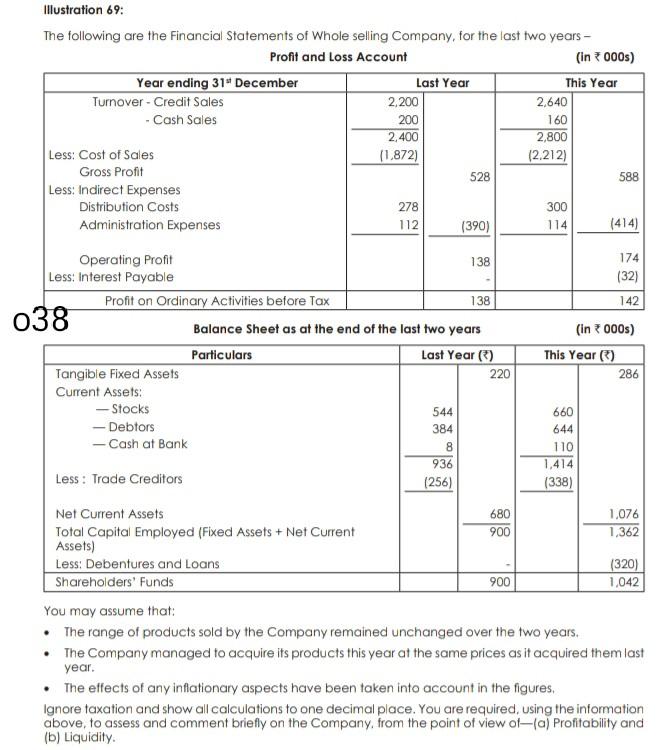
Illustration 69: The following are the Financial Statements of Whole selling Company, for the last two years - Profit and Loss Account (in 000s) Year

Illustration 69: The following are the Financial Statements of Whole selling Company, for the last two years - Profit and Loss Account (in 000s) Year ending 31" December Last Year This Year Turnover - Credit Sales 2,200 2,640 - Cash Sales 200 160 2.400 2,800 Less: Cost of Sales (1.872) (2.212) Gross Profit 528 588 Less: Indirect Expenses Distribution Costs 278 300 Administration Expenses 112 (390) 114 (414) 138 174 (32) 142 Operating Profit Less: Interest Payable Profit on Ordinary Activities before Tax 138 038 Balance Sheet as at the end of the last two years Particulars Last Year (*) Tangible Fixed Assets 220 Current Assets: - Stocks -Debtors - Cash at Bank 936 Less: Trade Creditors (256) (in 2000s) This Year) 286 544 384 8 660 644 110 1.414 (338) 900 Net Current Assets 680 1,076 Total Capital Employed (Fixed Assets + Net Current 1,362 Assets) Less: Debentures and Loans (320) Shareholders' Funds 900 1,042 You may assume that: The range of products sold by the Company remained unchanged over the two years, The Company managed to acquire its products this year at the same prices as it acquired them last year. The effects of any inflationary aspects have been taken into account in the figures. Ignore taxation and show all calculations to one decimal place. You are required, using the information above, to assess and comment briefly on the Company, from the point of view of-a) Profitability and (b) Liquidity
Step by Step Solution
There are 3 Steps involved in it
Step: 1

Get Instant Access to Expert-Tailored Solutions
See step-by-step solutions with expert insights and AI powered tools for academic success
Step: 2

Step: 3

Ace Your Homework with AI
Get the answers you need in no time with our AI-driven, step-by-step assistance
Get Started


