Answered step by step
Verified Expert Solution
Question
1 Approved Answer
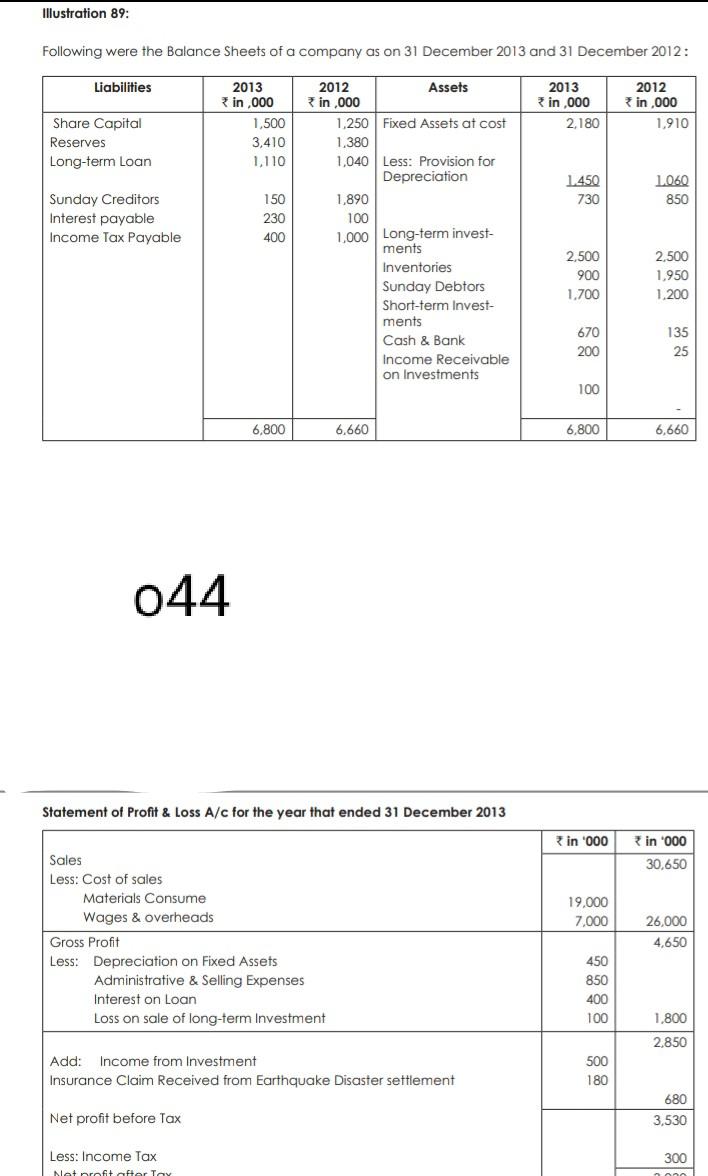
Illustration 89: Following were the Balance Sheets of a company as on 31 December 2013 and 31 December 2012: Liabilities 2013 in ,000 1,500 3,410

Illustration 89: Following were the Balance Sheets of a company as on 31 December 2013 and 31 December 2012: Liabilities 2013 in ,000 1,500 3,410 1,110 2013 in ,000 2,180 2012 in ,000 1.910 Share Capital Reserves Long-term Loan 1.450 730 1060 850 Sunday Creditors Interest payable Income Tax Payable 150 230 400 2012 Assets in ,000 1.250 Fixed Assets at cost 1.380 1,040 Less: Provision for Depreciation 1.890 100 1,000 Long-term invest- ments Inventories Sunday Debtors Short-term Invest ments Cash & Bank Income Receivable on Investments 2.500 900 1.700 2.500 1,950 1.200 670 200 135 25 100 6.800 6,660 6.800 6,660 044 Statement of Profit & Loss A/c for the year that ended 31 December 2013 in '000 in '000 30,650 19,000 7,000 Sales Less: Cost of sales Materials Consume Wages & overheads Gross Profit Less: Depreciation on Fixed Assets Administrative & Selling Expenses Interest on Loan Loss on sale of long-term Investment 26,000 4,650 450 850 400 100 1.800 2,850 Add: Income from Investment Insurance Claim Received from Earthquake Disaster settlement 500 180 Net profit before Tax 680 3,530 Less: Income Tax Natrofit after T 300 mono
Step by Step Solution
There are 3 Steps involved in it
Step: 1

Get Instant Access to Expert-Tailored Solutions
See step-by-step solutions with expert insights and AI powered tools for academic success
Step: 2

Step: 3

Ace Your Homework with AI
Get the answers you need in no time with our AI-driven, step-by-step assistance
Get Started


